To Die is Hard (2010)
| Theatrical Performance | ||
| Domestic Box Office | $5,129 | Details |
| OpusData ID: 169240100 More info... | ||
| Further financial details... | ||
Synopsis
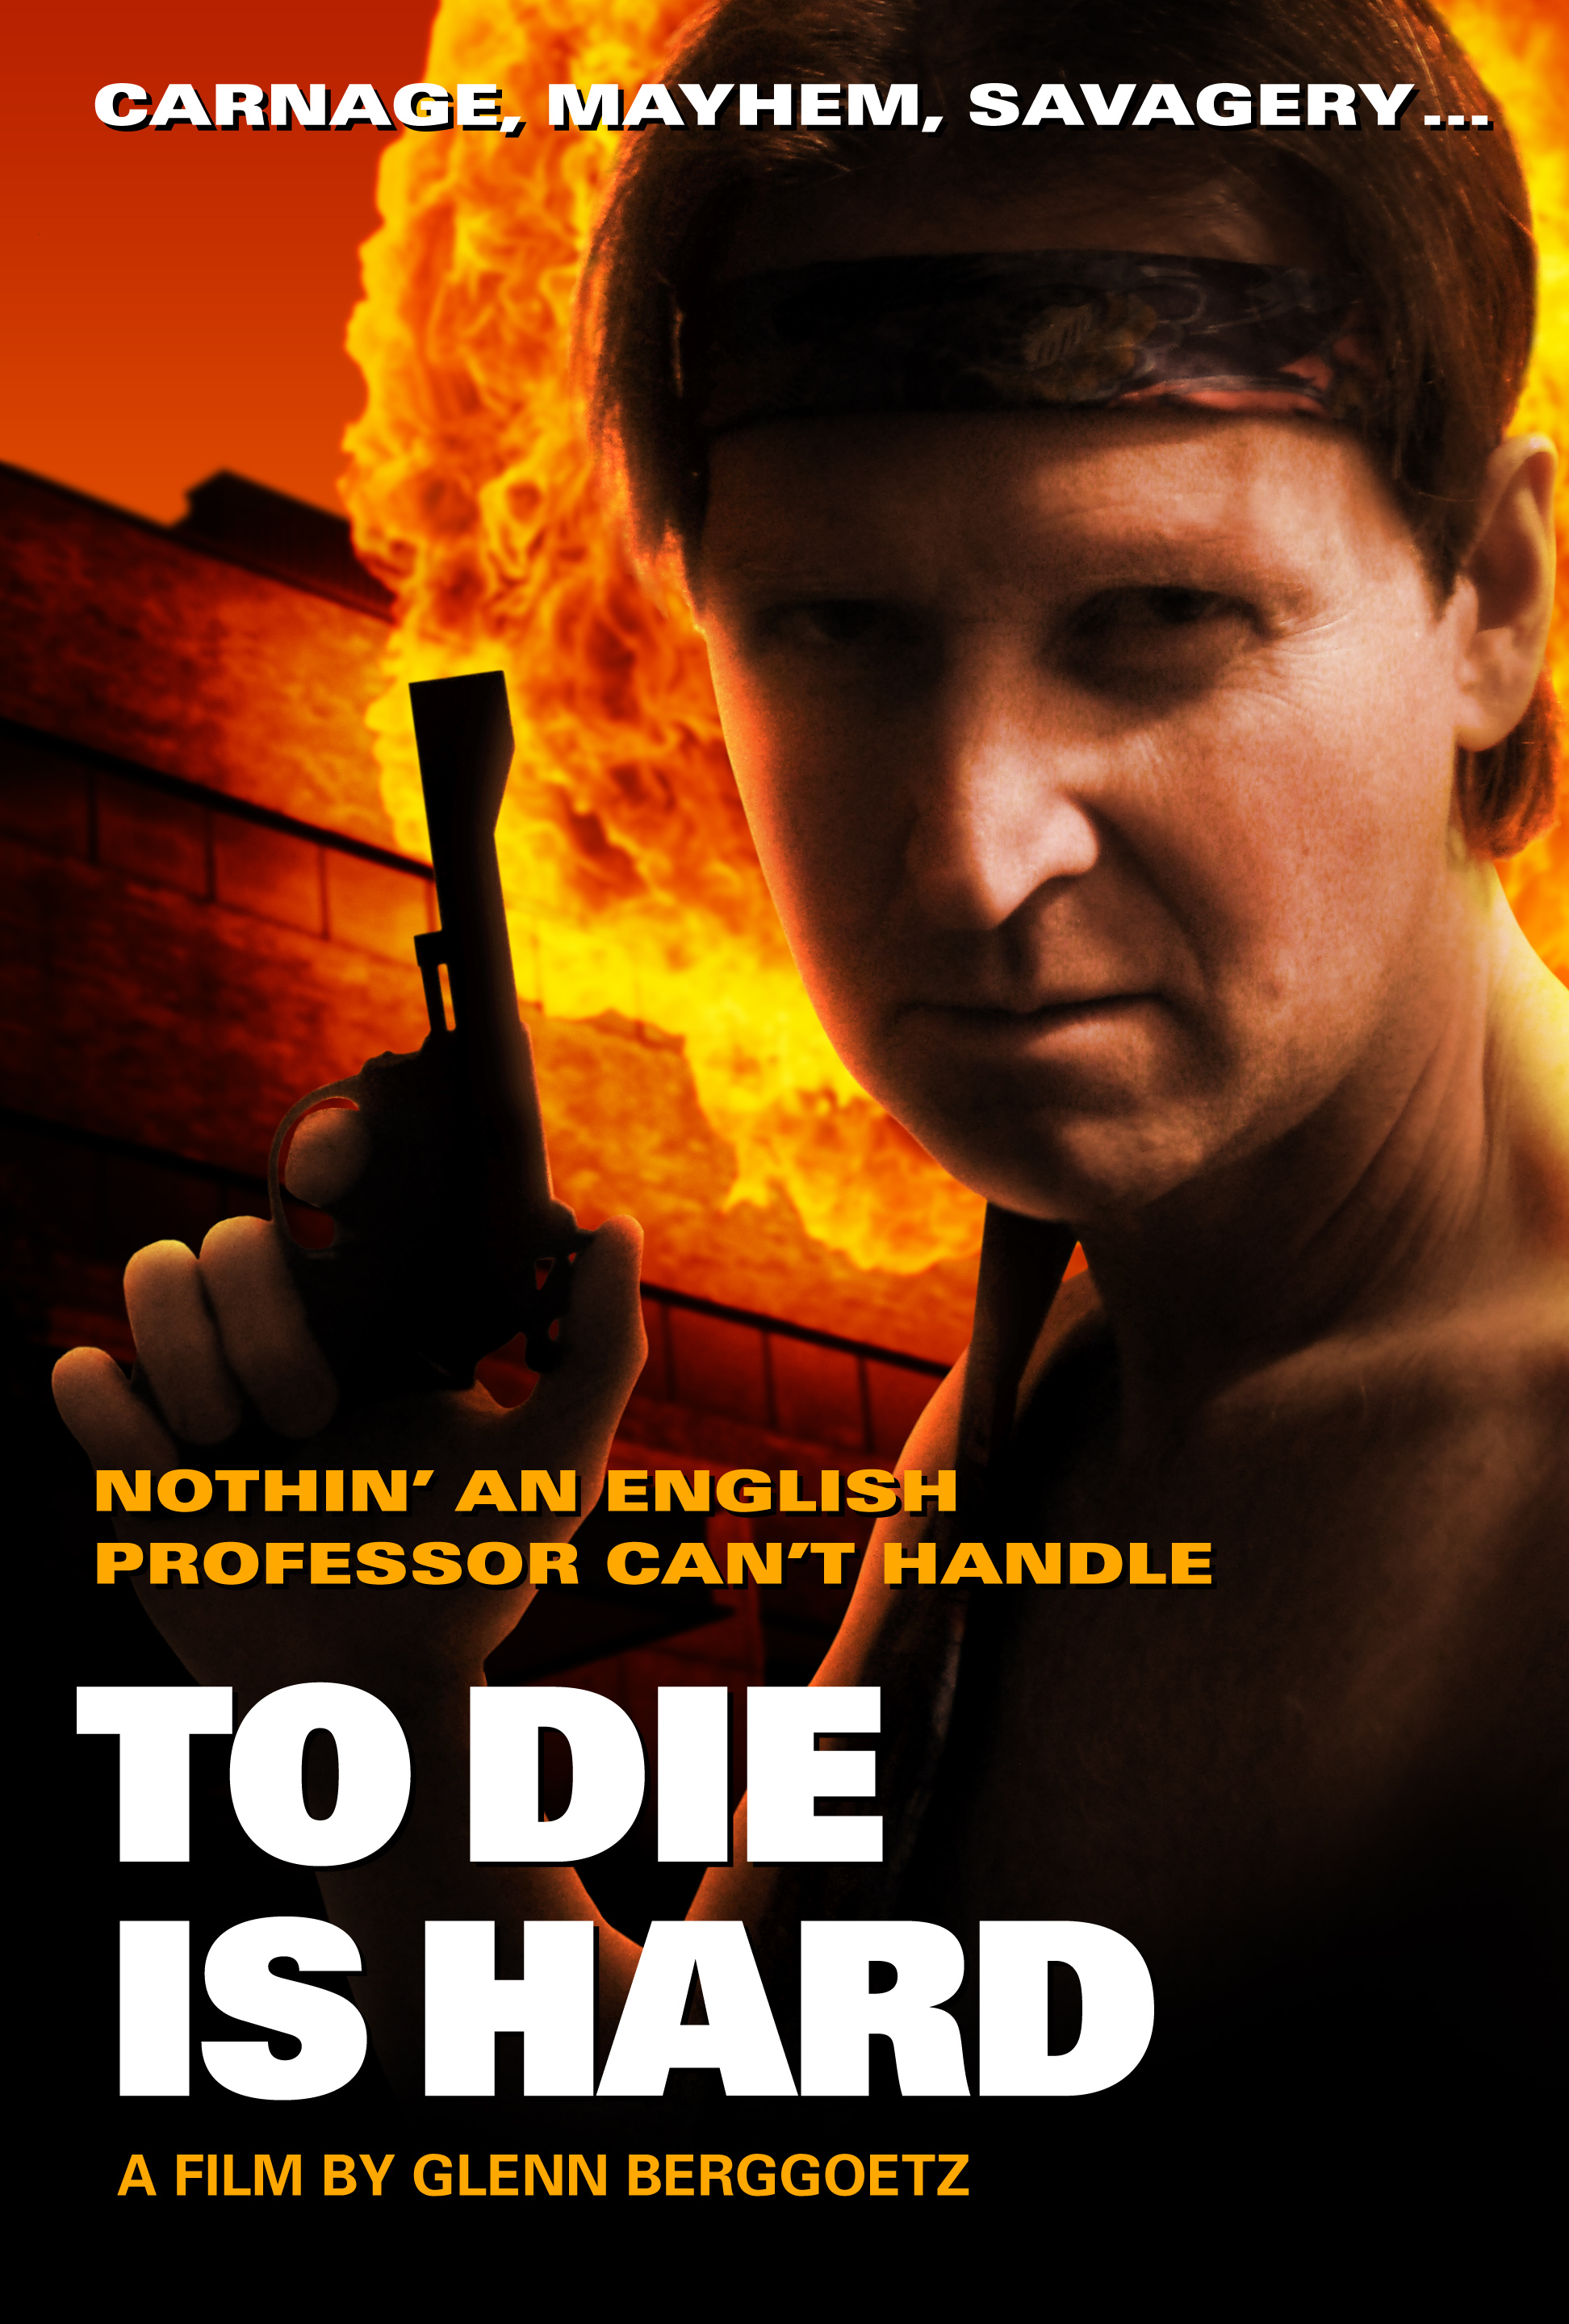
When a gang of terrorists invade a campus building, Dr. Joe McCann shows that he's not just an English professor, he's an action hero.
Metrics
| Opening Weekend: | $112 (2.2% of total gross) |
| Legs: | 3.45 (domestic box office/biggest weekend) |
| Domestic Share: | 100.0% (domestic box office/worldwide) |
| Theater counts: | 1 opening theaters/1 max. theaters, 5.0 weeks average run per theater |
| Infl. Adj. Dom. BO | $7,510 |
Movie Details
| Domestic Releases: | December 17th, 2010 (Limited) by Driving With Our Eyes Shut |
| MPA Rating: | Not Rated |
| Running Time: | 87 minutes |
| Source: | Original Screenplay |
| Genre: | Comedy |
| Production Method: | Live Action |
| Creative Type: | Contemporary Fiction |
| Production/Financing Companies: | Driving With Our Eyes Shut |
| Production Countries: | United States |
| Languages: | English |
Weekend Box Office Performance
| Date | Rank | Gross | % Change | Theaters | Per Theater | Total Gross | Week |
|---|---|---|---|---|---|---|---|
| Dec 17, 2010 | 105 | $112 | 1 | $112 | $112 | 1 | |
| Dec 30, 2011 | 80 | $810 | 1 | $810 | $2,050 | 55 | |
| Jun 13, 2014 | 105 | $595 | 1 | $595 | $2,701 | 183 | |
| Jun 27, 2014 | 96 | $1,488 | 1 | $1,488 | $4,189 | 185 | |
| Oct 5, 2018 | 99 | $580 | 1 | $580 | $5,129 | 408 |
Daily Box Office Performance
| Date | Rank | Gross | %YD | %LW | Theaters | Per Theater | Total Gross | Days |
|---|---|---|---|---|---|---|---|---|
| Jul 7, 2011 | - | $280 | 1 | $280 | $392 | 203 | ||
| Nov 11, 2011 | - | $848 | 1 | $848 | $1,240 | 330 | ||
| Dec 30, 2011 | - | $810 | 1 | $810 | $2,050 | 379 | ||
| Feb 7, 2013 | - | $56 | 1 | $56 | $2,106 | 784 |
Weekly Box Office Performance
| Date | Rank | Gross | % Change | Theaters | Per Theater | Total Gross | Week |
|---|---|---|---|---|---|---|---|
| Dec 17, 2010 | 114 | $112 | 1 | $112 | $112 | 1 | |
| Jul 1, 2011 | 112 | $280 | 1 | $280 | $392 | 29 | |
| Feb 1, 2013 | 96 | $56 | 1 | $56 | $2,106 | 112 | |
| Aug 8, 2014 | 103 | $360 | 1 | $360 | $4,549 | 191 |
Leading
| Glenn Berggoetz | Dr. Joe McCann |
Supporting
| Baird Lefter | Anton | |
| Lauren von Engeln | Amy | |
| Greg Nemer | Det. Al Stimpson | |
| Will Beckingham | Stewart | |
| Stephanie VanGels | Sandy | |
| Haidyn Janae Harvey | Emily | |
| Lauren Yormack | Gina | |
| Ashley Henkle | Andrea | |
| Jeff McBride | Jeff | |
| Eileen Barker | Scarley | |
| Stuart Goldstein | Turk | |
| Diane Henry | Sitting Woman |
Production and Technical Credits
| Glenn Berggoetz | Director | |
| Glenn Berggoetz | Screenwriter | |
| Glenn Berggoetz | Producer | |
| Alan Dague-Green | Director of Photography | |
| Alan Dague-Green | Editor | |
| Nick Falls | Sound |
Cast and crew with above-the-line roles are marked in bold. The line marks the division between above-the-line and below-the-line roles.
Full financial estimates for this film, including domestic and international box office, video sales, video rentals, TV and ancillary revenue are available through our research services. For more information, please contact us at research@the-numbers.com.
Synopsis
When a gang of terrorists invade a campus building, Dr. Joe McCann shows that he's not just an English professor, he's an action hero.
Metrics
| Opening Weekend: | $112 (2.2% of total gross) |
| Legs: | 3.45 (domestic box office/biggest weekend) |
| Domestic Share: | 100.0% (domestic box office/worldwide) |
| Theater counts: | 1 opening theaters/1 max. theaters, 5.0 weeks average run per theater |
| Infl. Adj. Dom. BO | $7,510 |
Movie Details
| Domestic Releases: | December 17th, 2010 (Limited) by Driving With Our Eyes Shut |
| MPA Rating: | Not Rated |
| Running Time: | 87 minutes |
| Source: | Original Screenplay |
| Genre: | Comedy |
| Production Method: | Live Action |
| Creative Type: | Contemporary Fiction |
| Production/Financing Companies: | Driving With Our Eyes Shut |
| Production Countries: | United States |
| Languages: | English |
Weekend Box Office Performance
| Date | Rank | Gross | % Change | Theaters | Per Theater | Total Gross | Week |
|---|---|---|---|---|---|---|---|
| Dec 17, 2010 | 105 | $112 | 1 | $112 | $112 | 1 | |
| Dec 30, 2011 | 80 | $810 | 1 | $810 | $2,050 | 55 | |
| Jun 13, 2014 | 105 | $595 | 1 | $595 | $2,701 | 183 | |
| Jun 27, 2014 | 96 | $1,488 | 1 | $1,488 | $4,189 | 185 | |
| Oct 5, 2018 | 99 | $580 | 1 | $580 | $5,129 | 408 |
Daily Box Office Performance
| Date | Rank | Gross | %YD | %LW | Theaters | Per Theater | Total Gross | Days |
|---|---|---|---|---|---|---|---|---|
| Jul 7, 2011 | - | $280 | 1 | $280 | $392 | 203 | ||
| Nov 11, 2011 | - | $848 | 1 | $848 | $1,240 | 330 | ||
| Dec 30, 2011 | - | $810 | 1 | $810 | $2,050 | 379 | ||
| Feb 7, 2013 | - | $56 | 1 | $56 | $2,106 | 784 |
Weekly Box Office Performance
| Date | Rank | Gross | % Change | Theaters | Per Theater | Total Gross | Week |
|---|---|---|---|---|---|---|---|
| Dec 17, 2010 | 114 | $112 | 1 | $112 | $112 | 1 | |
| Jul 1, 2011 | 112 | $280 | 1 | $280 | $392 | 29 | |
| Feb 1, 2013 | 96 | $56 | 1 | $56 | $2,106 | 112 | |
| Aug 8, 2014 | 103 | $360 | 1 | $360 | $4,549 | 191 |
Leading
| Glenn Berggoetz | Dr. Joe McCann |
Supporting
| Baird Lefter | Anton | |
| Lauren von Engeln | Amy | |
| Greg Nemer | Det. Al Stimpson | |
| Will Beckingham | Stewart | |
| Stephanie VanGels | Sandy | |
| Haidyn Janae Harvey | Emily | |
| Lauren Yormack | Gina | |
| Ashley Henkle | Andrea | |
| Jeff McBride | Jeff | |
| Eileen Barker | Scarley | |
| Stuart Goldstein | Turk | |
| Diane Henry | Sitting Woman |
Production and Technical Credits
| Glenn Berggoetz | Director | |
| Glenn Berggoetz | Screenwriter | |
| Glenn Berggoetz | Producer | |
| Alan Dague-Green | Director of Photography | |
| Alan Dague-Green | Editor | |
| Nick Falls | Sound |
Cast and crew with above-the-line roles are marked in bold. The line marks the division between above-the-line and below-the-line roles.
Full financial estimates for this film, including domestic and international box office, video sales, video rentals, TV and ancillary revenue are available through our research services. For more information, please contact us at research@the-numbers.com.