Trade of Innocents (2012)
| Theatrical Performance | ||
| Domestic Box Office | $15,091 | Details |
| OpusData ID: 171240100 More info... | ||
| Further financial details... | ||
Synopsis
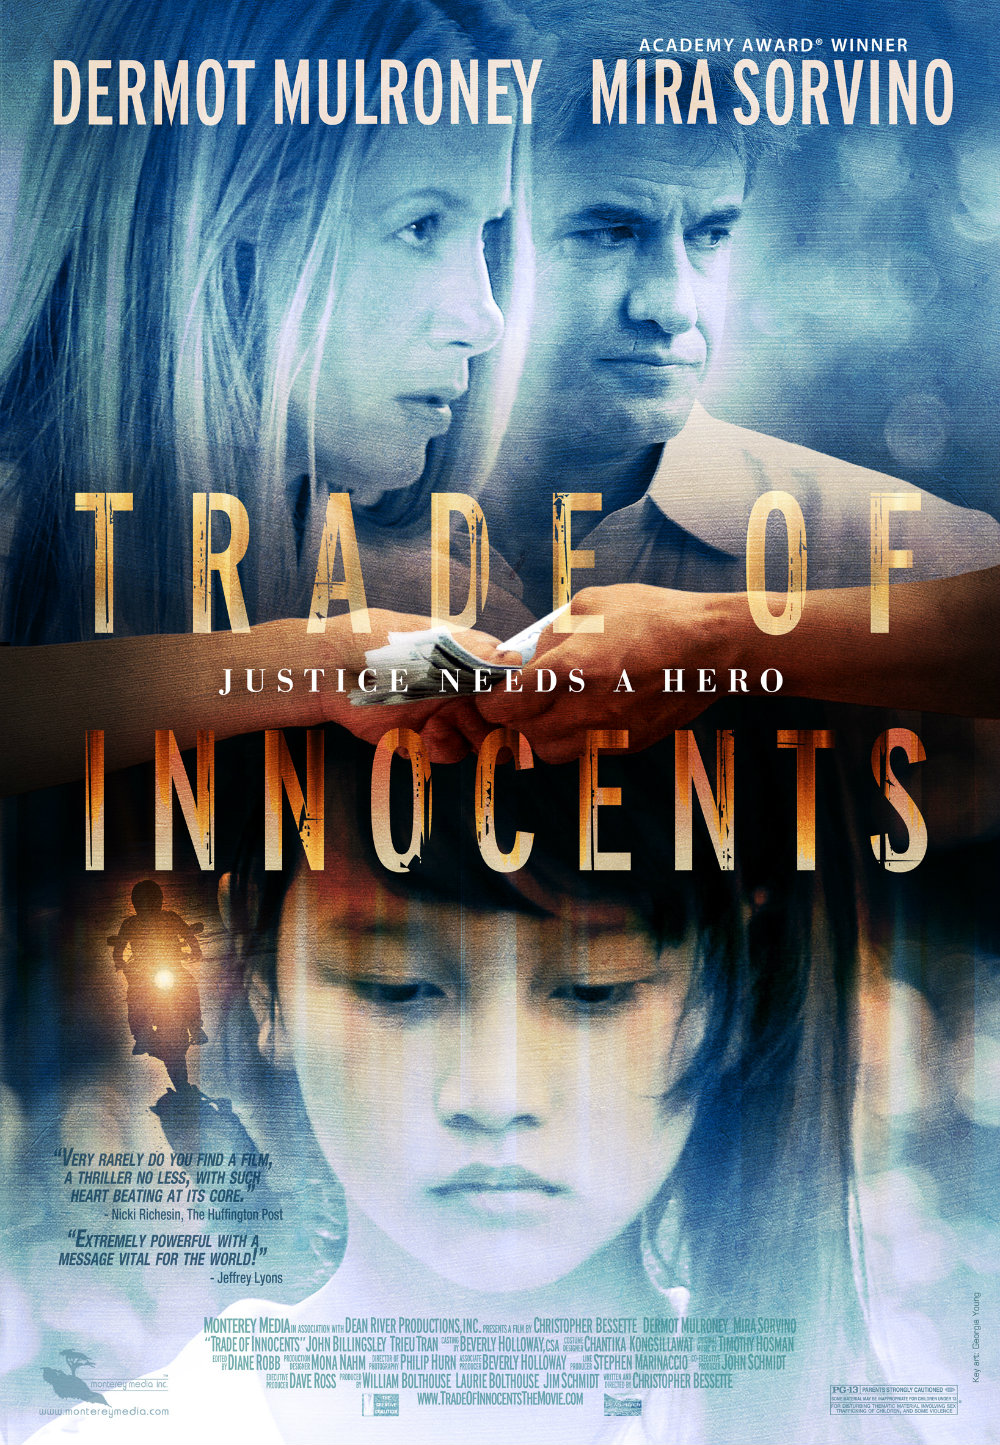
In present day South East Asia, down dark alleys, in secret rooms, children are for sale. Parallel story lines intertwine and twists unfold against the backdrop of the dangerous human trafficking world, in a story of struggle, life, hope and redemption.
Metrics
| Opening Weekend: | $588 (3.9% of total gross) |
| Legs: | 1.95 (domestic box office/biggest weekend) |
| Domestic Share: | 100.0% (domestic box office/worldwide) |
| Production Budget: | $5,800,000 (worldwide box office is 0.0 times production budget) |
| Theater counts: | 1 opening theaters/3 max. theaters, 3.7 weeks average run per theater |
| Infl. Adj. Dom. BO | $22,676 |
Movie Details
| Domestic Releases: | October 5th, 2012 (Limited) by Monterey Media |
| MPA Rating: | PG-13 for disturbing thematic material involving sex trafficking of children, and some violence. (Rating bulletin 2203, 12/21/2011) |
| Running Time: | 91 minutes |
| Cast, crew, or production detail: | Agitprop, Epilogue |
| Plot point: | Child Abuse, Prostitution, Sex Crimes |
| Social setting: | Human-Trafficking |
| Source: | Original Screenplay |
| Genre: | Thriller/Suspense |
| Production Method: | Live Action |
| Creative Type: | Contemporary Fiction |
| Production/Financing Companies: | Dean River |
| Production Countries: | United States, Thailand |
| Languages: | English, French |
Weekend Box Office Performance
| Date | Rank | Gross | % Change | Theaters | Per Theater | Total Gross | Week |
|---|---|---|---|---|---|---|---|
| Oct 5, 2012 | 98 | $588 | 1 | $588 | $588 | 1 | |
| Oct 12, 2012 | 74 | $7,740 | +1,216% | 3 | $2,580 | $8,755 | 2 |
| Oct 19, 2012 | 101 | $325 | -96% | 1 | $325 | $12,148 | 3 |
| Oct 26, 2012 | 99 | $1,295 | +298% | 3 | $432 | $13,649 | 4 |
| Nov 2, 2012 | 94 | $1,039 | -20% | 3 | $346 | $15,059 | 5 |
Weekly Box Office Performance
| Date | Rank | Gross | % Change | Theaters | Per Theater | Total Gross | Week |
|---|---|---|---|---|---|---|---|
| Oct 5, 2012 | 97 | $1,015 | 1 | $1,015 | $1,015 | 1 | |
| Oct 12, 2012 | 76 | $10,808 | +965% | 3 | $3,603 | $11,823 | 2 |
| Oct 19, 2012 | 108 | $531 | -95% | 1 | $531 | $12,354 | 3 |
| Oct 26, 2012 | 98 | $1,666 | +214% | 3 | $555 | $14,020 | 4 |
| Nov 2, 2012 | 104 | $1,071 | -36% | 3 | $357 | $15,091 | 5 |
Leading
| Dermot Mulroney | Alex Becker | |
| Mira Sorvino | Claire Becker |
Supporting
| John Billingsley | Malcolm Eddery | |
| Trieu Tran | Duke |
Production and Technical Credits
| Christopher Bessette | Director | |
| Christopher Bessette | Screenwriter | |
| Bill Bolthouse | Producer | |
| Laurie Bolthouse | Producer | |
| Jim Schmidt | Producer | |
| Dave Ross | Executive Producer | |
| Philip Hurn | Director of Photography | |
| Diane Brunjes Robb | Editor | |
| Mona Nahm | Production Designer | |
| Timothy Hosman | Origianal Score | |
| Beverly Holloway | Casting |
Cast and crew with above-the-line roles are marked in bold. The line marks the division between above-the-line and below-the-line roles.
Full financial estimates for this film, including domestic and international box office, video sales, video rentals, TV and ancillary revenue are available through our research services. For more information, please contact us at research@the-numbers.com.
Synopsis
In present day South East Asia, down dark alleys, in secret rooms, children are for sale. Parallel story lines intertwine and twists unfold against the backdrop of the dangerous human trafficking world, in a story of struggle, life, hope and redemption.
Metrics
| Opening Weekend: | $588 (3.9% of total gross) |
| Legs: | 1.95 (domestic box office/biggest weekend) |
| Domestic Share: | 100.0% (domestic box office/worldwide) |
| Production Budget: | $5,800,000 (worldwide box office is 0.0 times production budget) |
| Theater counts: | 1 opening theaters/3 max. theaters, 3.7 weeks average run per theater |
| Infl. Adj. Dom. BO | $22,676 |
Movie Details
| Domestic Releases: | October 5th, 2012 (Limited) by Monterey Media |
| MPA Rating: | PG-13 for disturbing thematic material involving sex trafficking of children, and some violence. (Rating bulletin 2203, 12/21/2011) |
| Running Time: | 91 minutes |
| Cast, crew, or production detail: | Agitprop, Epilogue |
| Plot point: | Child Abuse, Prostitution, Sex Crimes |
| Social setting: | Human-Trafficking |
| Source: | Original Screenplay |
| Genre: | Thriller/Suspense |
| Production Method: | Live Action |
| Creative Type: | Contemporary Fiction |
| Production/Financing Companies: | Dean River |
| Production Countries: | United States, Thailand |
| Languages: | English, French |
Weekend Box Office Performance
| Date | Rank | Gross | % Change | Theaters | Per Theater | Total Gross | Week |
|---|---|---|---|---|---|---|---|
| Oct 5, 2012 | 98 | $588 | 1 | $588 | $588 | 1 | |
| Oct 12, 2012 | 74 | $7,740 | +1,216% | 3 | $2,580 | $8,755 | 2 |
| Oct 19, 2012 | 101 | $325 | -96% | 1 | $325 | $12,148 | 3 |
| Oct 26, 2012 | 99 | $1,295 | +298% | 3 | $432 | $13,649 | 4 |
| Nov 2, 2012 | 94 | $1,039 | -20% | 3 | $346 | $15,059 | 5 |
Weekly Box Office Performance
| Date | Rank | Gross | % Change | Theaters | Per Theater | Total Gross | Week |
|---|---|---|---|---|---|---|---|
| Oct 5, 2012 | 97 | $1,015 | 1 | $1,015 | $1,015 | 1 | |
| Oct 12, 2012 | 76 | $10,808 | +965% | 3 | $3,603 | $11,823 | 2 |
| Oct 19, 2012 | 108 | $531 | -95% | 1 | $531 | $12,354 | 3 |
| Oct 26, 2012 | 98 | $1,666 | +214% | 3 | $555 | $14,020 | 4 |
| Nov 2, 2012 | 104 | $1,071 | -36% | 3 | $357 | $15,091 | 5 |
Leading
| Dermot Mulroney | Alex Becker | |
| Mira Sorvino | Claire Becker |
Supporting
| John Billingsley | Malcolm Eddery | |
| Trieu Tran | Duke |
Production and Technical Credits
| Christopher Bessette | Director | |
| Christopher Bessette | Screenwriter | |
| Bill Bolthouse | Producer | |
| Laurie Bolthouse | Producer | |
| Jim Schmidt | Producer | |
| Dave Ross | Executive Producer | |
| Philip Hurn | Director of Photography | |
| Diane Brunjes Robb | Editor | |
| Mona Nahm | Production Designer | |
| Timothy Hosman | Origianal Score | |
| Beverly Holloway | Casting |
Cast and crew with above-the-line roles are marked in bold. The line marks the division between above-the-line and below-the-line roles.
Full financial estimates for this film, including domestic and international box office, video sales, video rentals, TV and ancillary revenue are available through our research services. For more information, please contact us at research@the-numbers.com.