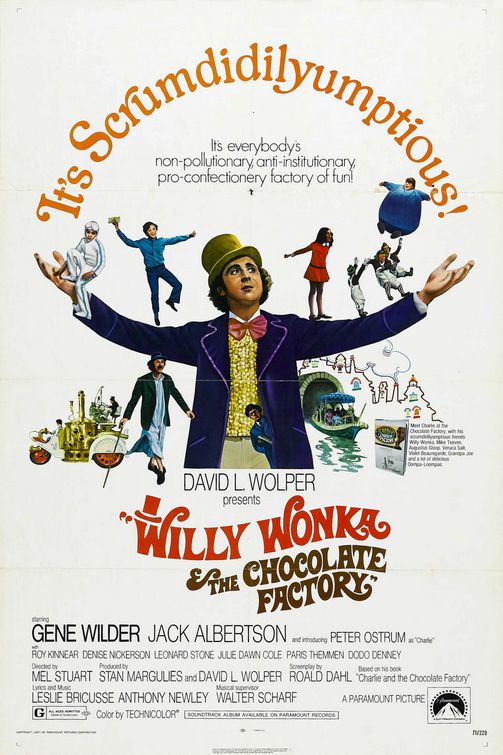
Willy Wonka & the Chocolate Factory (1971)
| Theatrical Performance | ||
| Domestic Box Office | $5,747,299 | Details |
| International Box Office | $65,779 | |
| Worldwide Box Office | $5,813,078 | |
| Domestic Physical Disc Sales | ||
| DVD Sales (estimated) | $14,435,108 | |
| Blu-ray Sales (estimated) | $17,015,192 | |
| Total | $31,450,300 | |
| Further financial details... | ||
Synopsis
When eccentric candy man Willy Wonka promises a lifetime supply of sweets and a tour of his chocolate factory to five lucky kids, penniless Charlie Bucket seeks the priceless golden ticket that will make him a winner. Thanks to his Grandpa Joe, Charlie gets the prize of his dreams! But a far more wonderful surprise than Charlie ever imagined awaits him.
Metrics
| Domestic Share: | 98.9% (domestic box office/worldwide) |
| Production Budget: | $3,000,000 (worldwide box office is 1.9 times production budget) |
Movie Details
| Domestic Releases: | June 30th, 1971 (Wide) by Paramount Pictures November 21st, 2025 (Limited) by Warner Bros. August 2nd, 2026 (Special Engagement) by Fathom Entertainment (55th Anniversary) |
| International Releases: | July 27th, 1972 (Wide), released as Willy Wonka y la Fábrica de Chocolate (Mexico)
December 28th, 2001 (Wide), released as Willy Wonka (re) (Australia) June 26th, 2020 (Wide) (New Zealand) November 5th, 2021 (Limited), released as Willy Wonka And The Chocolate Factory (Re: 2021) (United Kingdom) November 30th, 2023 (Limited), released as Willy Wonka y la Fábrica de Chocolate (Mexico) |
| Video Release: | October 1st, 1996 by Warner Home Video, released as Willy Wonka and the Chocolate Factory |
| MPA Rating: | G |
| Running Time: | 100 minutes |
| Franchise: | Charlie and the Chocolate Factory |
| Cast, crew, or production detail: | Remade |
| Plot point: | Food, Poverty, Rags to Riches, Spoiled Child |
| Source material: | Novel or Other Work Adapted by Author |
| Subgenre: | Family Musical |
| Source: | Based on Fiction Book/Short Story |
| Genre: | Musical |
| Production Method: | Live Action |
| Creative Type: | Kids Fiction |
| Production Countries: | United States |
| Languages: | English |