The Woodmans (2011)
| Theatrical Performance | ||
| Domestic Box Office | $46,623 | Details |
| OpusData ID: 152240100 More info... | ||
| Further financial details... | ||
Synopsis
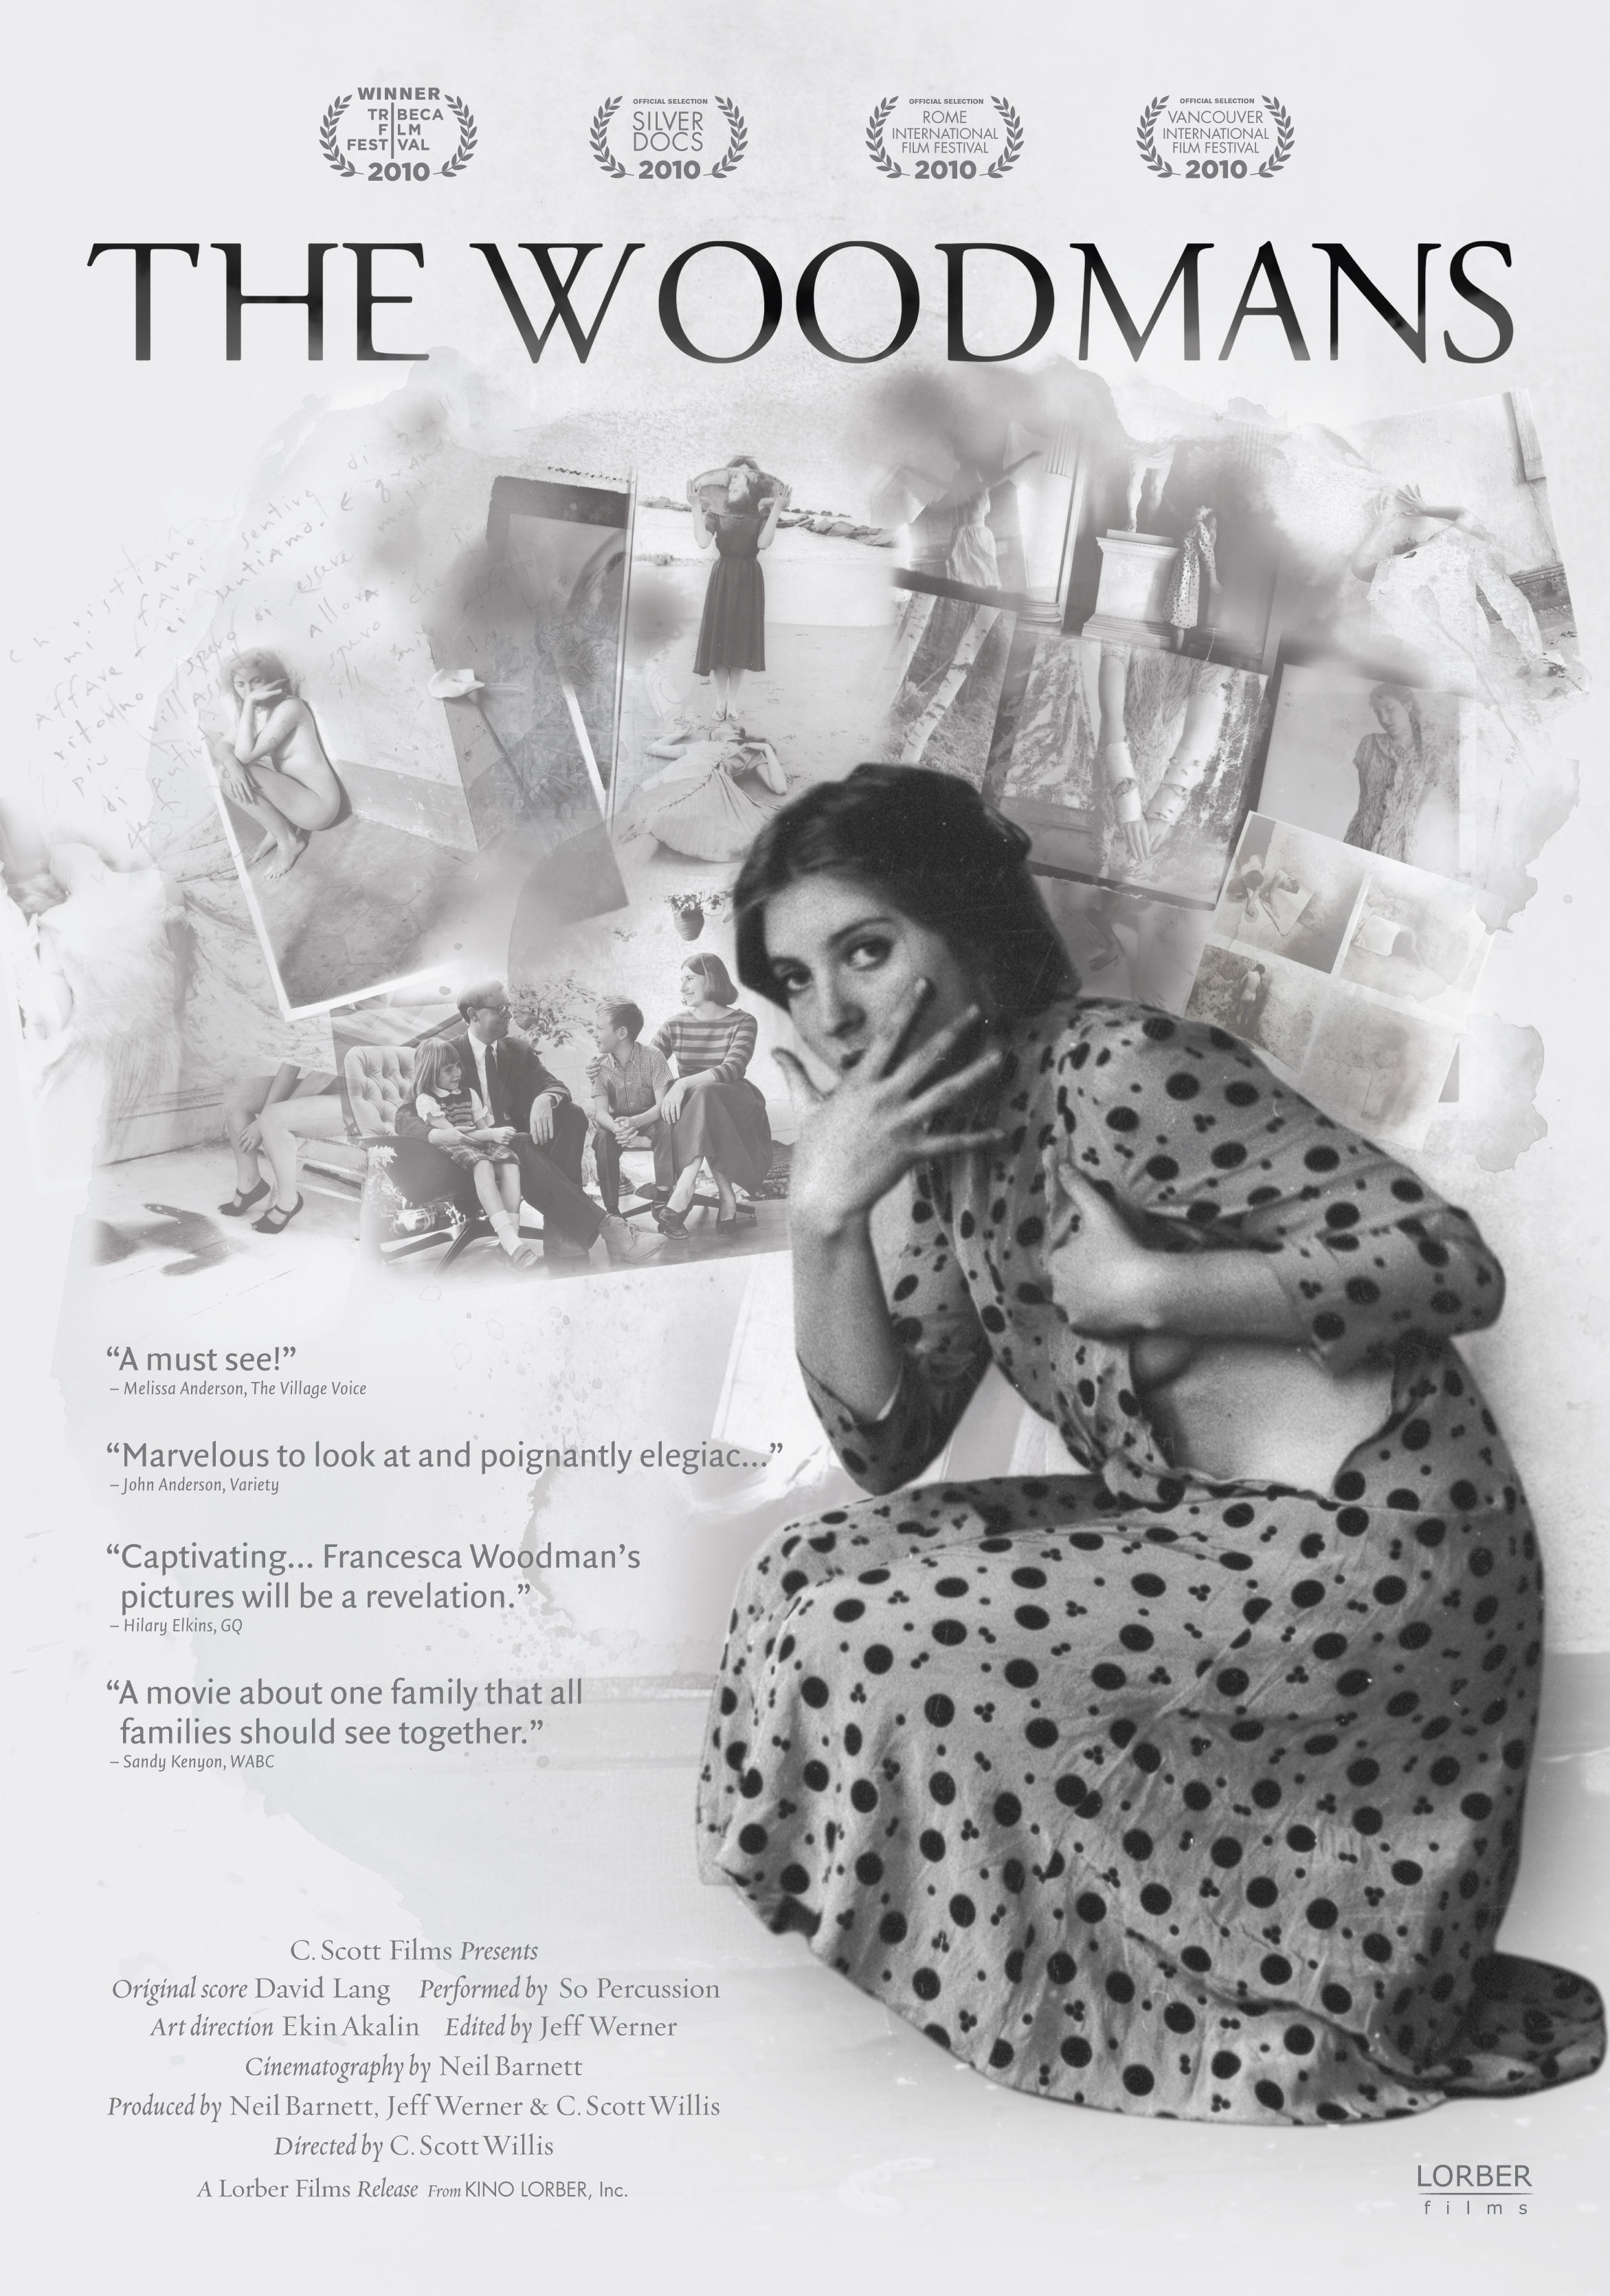
A portrait of the late photographer Francesca Woodman, told through the young artist’s work (including experimental videos and journal entries) and interviews with her artist parents Betty and Charles (a ceramic sculptor and painter/photographer), who have continued their own artistic practices while watching Francesca’s professional reputation eclipse their own.
Metrics
| Opening Weekend: | $5,874 (12.6% of total gross) |
| Legs: | 5.18 (domestic box office/biggest weekend) |
| Domestic Share: | 100.0% (domestic box office/worldwide) |
| Theater counts: | 1 opening theaters/3 max. theaters, 6.0 weeks average run per theater |
| Infl. Adj. Dom. BO | $70,313 |
Movie Details
| Domestic Releases: | January 19th, 2011 (Limited) by Lorber Films |
| MPA Rating: | Not Rated |
| Running Time: | 82 minutes |
| Plot point: | Artists, Biography |
| Source: | Based on Real Life Events |
| Genre: | Documentary |
| Production Method: | Live Action |
| Creative Type: | Factual |
| Production/Financing Companies: | C. Scott Films |
| Production Countries: | China, Italy |
| Languages: | English |
Weekend Box Office Performance
| Date | Rank | Gross | % Change | Theaters | Per Theater | Total Gross | Week |
|---|---|---|---|---|---|---|---|
| Jan 21, 2011 | 66 | $5,874 | 1 | $5,874 | $9,560 | 1 | |
| Jan 28, 2011 | 59 | $8,998 | +53% | 3 | $2,999 | $23,293 | 2 |
| Feb 4, 2011 | 99 | $607 | -93% | 1 | $607 | $27,332 | 3 |
| Feb 11, 2011 | 97 | $1,068 | +76% | 2 | $534 | $29,576 | 4 |
| Feb 25, 2011 | 96 | $917 | 2 | $459 | $31,557 | 6 | |
| Mar 4, 2011 | 111 | $114 | -88% | 1 | $114 | $32,880 | 7 |
| Mar 25, 2011 | 120 | $82 | 1 | $82 | $33,965 | 10 | |
| Apr 1, 2011 | 115 | $772 | +841% | 2 | $386 | $34,875 | 11 |
| Apr 15, 2011 | 110 | $202 | 1 | $202 | $36,036 | 13 | |
| Aug 19, 2011 | 123 | $492 | 1 | $492 | $37,976 | 31 | |
| Aug 26, 2011 | 125 | $354 | -28% | 1 | $354 | $38,330 | 32 |
| Nov 18, 2011 | 92 | $1,935 | 1 | $1,935 | $40,601 | 44 | |
| Nov 25, 2011 | 103 | $287 | -85% | 1 | $287 | $42,069 | 45 |
Weekly Box Office Performance
| Date | Rank | Gross | % Change | Theaters | Per Theater | Total Gross | Week |
|---|---|---|---|---|---|---|---|
| Jan 14, 2011 | 86 | $3,686 | 1 | $3,686 | $3,686 | 1 | |
| Jan 21, 2011 | 60 | $10,609 | +188% | 1 | $10,609 | $14,295 | 2 |
| Jan 28, 2011 | 60 | $12,430 | +17% | 3 | $4,143 | $26,725 | 3 |
| Feb 4, 2011 | 91 | $1,783 | -86% | 2 | $892 | $28,508 | 4 |
| Feb 11, 2011 | 90 | $2,132 | +20% | 2 | $1,066 | $30,640 | 5 |
| Feb 25, 2011 | 91 | $2,126 | 2 | $1,063 | $32,766 | 7 | |
| Mar 4, 2011 | 107 | $543 | -74% | 3 | $181 | $33,309 | 8 |
| Mar 11, 2011 | 117 | $574 | +6% | 1 | $574 | $33,883 | 9 |
| Mar 25, 2011 | 124 | $220 | 1 | $220 | $34,103 | 11 | |
| Apr 1, 2011 | 109 | $1,731 | +687% | 2 | $866 | $35,834 | 12 |
| Apr 15, 2011 | 115 | $378 | 1 | $378 | $36,212 | 14 | |
| Apr 22, 2011 | 122 | $386 | +2% | 1 | $386 | $36,598 | 15 |
| Jun 17, 2011 | 110 | $276 | 1 | $276 | $36,874 | 23 | |
| Aug 12, 2011 | 128 | $610 | 1 | $610 | $37,484 | 31 | |
| Aug 19, 2011 | 129 | $492 | -19% | 1 | $492 | $37,976 | 32 |
| Aug 26, 2011 | 132 | $354 | -28% | 1 | $354 | $38,330 | 33 |
| Nov 18, 2011 | 92 | $3,116 | 1 | $3,116 | $41,782 | 45 | |
| Nov 25, 2011 | 95 | $657 | -79% | 1 | $657 | $46,623 | 46 |
Full financial estimates for this film, including domestic and international box office, video sales, video rentals, TV and ancillary revenue are available through our research services. For more information, please contact us at research@the-numbers.com.
Synopsis
A portrait of the late photographer Francesca Woodman, told through the young artist’s work (including experimental videos and journal entries) and interviews with her artist parents Betty and Charles (a ceramic sculptor and painter/photographer), who have continued their own artistic practices while watching Francesca’s professional reputation eclipse their own.
Metrics
| Opening Weekend: | $5,874 (12.6% of total gross) |
| Legs: | 5.18 (domestic box office/biggest weekend) |
| Domestic Share: | 100.0% (domestic box office/worldwide) |
| Theater counts: | 1 opening theaters/3 max. theaters, 6.0 weeks average run per theater |
| Infl. Adj. Dom. BO | $70,313 |
Movie Details
| Domestic Releases: | January 19th, 2011 (Limited) by Lorber Films |
| MPA Rating: | Not Rated |
| Running Time: | 82 minutes |
| Plot point: | Artists, Biography |
| Source: | Based on Real Life Events |
| Genre: | Documentary |
| Production Method: | Live Action |
| Creative Type: | Factual |
| Production/Financing Companies: | C. Scott Films |
| Production Countries: | China, Italy |
| Languages: | English |
Weekend Box Office Performance
| Date | Rank | Gross | % Change | Theaters | Per Theater | Total Gross | Week |
|---|---|---|---|---|---|---|---|
| Jan 21, 2011 | 66 | $5,874 | 1 | $5,874 | $9,560 | 1 | |
| Jan 28, 2011 | 59 | $8,998 | +53% | 3 | $2,999 | $23,293 | 2 |
| Feb 4, 2011 | 99 | $607 | -93% | 1 | $607 | $27,332 | 3 |
| Feb 11, 2011 | 97 | $1,068 | +76% | 2 | $534 | $29,576 | 4 |
| Feb 25, 2011 | 96 | $917 | 2 | $459 | $31,557 | 6 | |
| Mar 4, 2011 | 111 | $114 | -88% | 1 | $114 | $32,880 | 7 |
| Mar 25, 2011 | 120 | $82 | 1 | $82 | $33,965 | 10 | |
| Apr 1, 2011 | 115 | $772 | +841% | 2 | $386 | $34,875 | 11 |
| Apr 15, 2011 | 110 | $202 | 1 | $202 | $36,036 | 13 | |
| Aug 19, 2011 | 123 | $492 | 1 | $492 | $37,976 | 31 | |
| Aug 26, 2011 | 125 | $354 | -28% | 1 | $354 | $38,330 | 32 |
| Nov 18, 2011 | 92 | $1,935 | 1 | $1,935 | $40,601 | 44 | |
| Nov 25, 2011 | 103 | $287 | -85% | 1 | $287 | $42,069 | 45 |
Weekly Box Office Performance
| Date | Rank | Gross | % Change | Theaters | Per Theater | Total Gross | Week |
|---|---|---|---|---|---|---|---|
| Jan 14, 2011 | 86 | $3,686 | 1 | $3,686 | $3,686 | 1 | |
| Jan 21, 2011 | 60 | $10,609 | +188% | 1 | $10,609 | $14,295 | 2 |
| Jan 28, 2011 | 60 | $12,430 | +17% | 3 | $4,143 | $26,725 | 3 |
| Feb 4, 2011 | 91 | $1,783 | -86% | 2 | $892 | $28,508 | 4 |
| Feb 11, 2011 | 90 | $2,132 | +20% | 2 | $1,066 | $30,640 | 5 |
| Feb 25, 2011 | 91 | $2,126 | 2 | $1,063 | $32,766 | 7 | |
| Mar 4, 2011 | 107 | $543 | -74% | 3 | $181 | $33,309 | 8 |
| Mar 11, 2011 | 117 | $574 | +6% | 1 | $574 | $33,883 | 9 |
| Mar 25, 2011 | 124 | $220 | 1 | $220 | $34,103 | 11 | |
| Apr 1, 2011 | 109 | $1,731 | +687% | 2 | $866 | $35,834 | 12 |
| Apr 15, 2011 | 115 | $378 | 1 | $378 | $36,212 | 14 | |
| Apr 22, 2011 | 122 | $386 | +2% | 1 | $386 | $36,598 | 15 |
| Jun 17, 2011 | 110 | $276 | 1 | $276 | $36,874 | 23 | |
| Aug 12, 2011 | 128 | $610 | 1 | $610 | $37,484 | 31 | |
| Aug 19, 2011 | 129 | $492 | -19% | 1 | $492 | $37,976 | 32 |
| Aug 26, 2011 | 132 | $354 | -28% | 1 | $354 | $38,330 | 33 |
| Nov 18, 2011 | 92 | $3,116 | 1 | $3,116 | $41,782 | 45 | |
| Nov 25, 2011 | 95 | $657 | -79% | 1 | $657 | $46,623 | 46 |
Full financial estimates for this film, including domestic and international box office, video sales, video rentals, TV and ancillary revenue are available through our research services. For more information, please contact us at research@the-numbers.com.