You Don't Need Feet to Dance (2013)
| Theatrical Performance | ||
| Domestic Box Office | $1,719 | Details |
| OpusData ID: 189440100 More info... | ||
| Further financial details... | ||
Synopsis
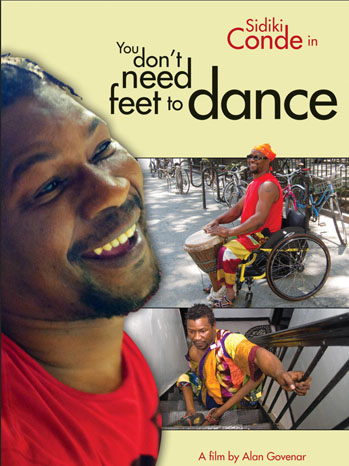
In the documentary film You Don’t Need Feet to Dance, African immigrant Sidiki Conde, having lost the use of his legs to polio at fourteen, balances his career as a performing artist with the almost insurmountable obstacles of life in New York City, from his fifth-floor walk up apartment in the East village, down the stairs with his hands and navigating in his wheelchair through Manhattan onto buses and into the subway. Sidiki struggles to cope with his disability and to earn a decent living, but he still manages to teach workshops for disabled kids, busk on the street, rehearse with his musical group, bicycle with his hands, and prepare for a baby naming ceremony, where he plays djembe drums, sings, and dances on his hands.
Metrics
| Opening Weekend: | $1,239 (72.1% of total gross) |
| Legs: | 1.39 (domestic box office/biggest weekend) |
| Domestic Share: | 100.0% (domestic box office/worldwide) |
| Theater counts: | 1 opening theaters/1 max. theaters, 1.0 weeks average run per theater |
| Infl. Adj. Dom. BO | $2,524 |
Movie Details
| Domestic Releases: | March 22nd, 2013 (Limited) by First Run Features |
| MPA Rating: | Not Rated |
| Running Time: | 88 minutes |
| Plot point: | Biography, Disability, Immigration, Musicians, Wheelchair User |
| Source: | Based on Real Life Events |
| Genre: | Documentary |
| Production Method: | Live Action |
| Creative Type: | Factual |
| Production/Financing Companies: | Documentary Arts |
| Production Countries: | United States |
| Languages: | English |
Weekend Box Office Performance
| Date | Rank | Gross | % Change | Theaters | Per Theater | Total Gross | Week |
|---|---|---|---|---|---|---|---|
| Mar 22, 2013 | 105 | $1,239 | 1 | $1,239 | $1,239 | 1 |
Weekly Box Office Performance
| Date | Rank | Gross | % Change | Theaters | Per Theater | Total Gross | Week |
|---|---|---|---|---|---|---|---|
| Mar 22, 2013 | 107 | $1,719 | 1 | $1,719 | $1,719 | 1 |
Full financial estimates for this film, including domestic and international box office, video sales, video rentals, TV and ancillary revenue are available through our research services. For more information, please contact us at research@the-numbers.com.
Synopsis
In the documentary film You Don’t Need Feet to Dance, African immigrant Sidiki Conde, having lost the use of his legs to polio at fourteen, balances his career as a performing artist with the almost insurmountable obstacles of life in New York City, from his fifth-floor walk up apartment in the East village, down the stairs with his hands and navigating in his wheelchair through Manhattan onto buses and into the subway. Sidiki struggles to cope with his disability and to earn a decent living, but he still manages to teach workshops for disabled kids, busk on the street, rehearse with his musical group, bicycle with his hands, and prepare for a baby naming ceremony, where he plays djembe drums, sings, and dances on his hands.
Metrics
| Opening Weekend: | $1,239 (72.1% of total gross) |
| Legs: | 1.39 (domestic box office/biggest weekend) |
| Domestic Share: | 100.0% (domestic box office/worldwide) |
| Theater counts: | 1 opening theaters/1 max. theaters, 1.0 weeks average run per theater |
| Infl. Adj. Dom. BO | $2,524 |
Movie Details
| Domestic Releases: | March 22nd, 2013 (Limited) by First Run Features |
| MPA Rating: | Not Rated |
| Running Time: | 88 minutes |
| Plot point: | Biography, Disability, Immigration, Musicians, Wheelchair User |
| Source: | Based on Real Life Events |
| Genre: | Documentary |
| Production Method: | Live Action |
| Creative Type: | Factual |
| Production/Financing Companies: | Documentary Arts |
| Production Countries: | United States |
| Languages: | English |
Weekend Box Office Performance
| Date | Rank | Gross | % Change | Theaters | Per Theater | Total Gross | Week |
|---|---|---|---|---|---|---|---|
| Mar 22, 2013 | 105 | $1,239 | 1 | $1,239 | $1,239 | 1 |
Weekly Box Office Performance
| Date | Rank | Gross | % Change | Theaters | Per Theater | Total Gross | Week |
|---|---|---|---|---|---|---|---|
| Mar 22, 2013 | 107 | $1,719 | 1 | $1,719 | $1,719 | 1 |
Full financial estimates for this film, including domestic and international box office, video sales, video rentals, TV and ancillary revenue are available through our research services. For more information, please contact us at research@the-numbers.com.