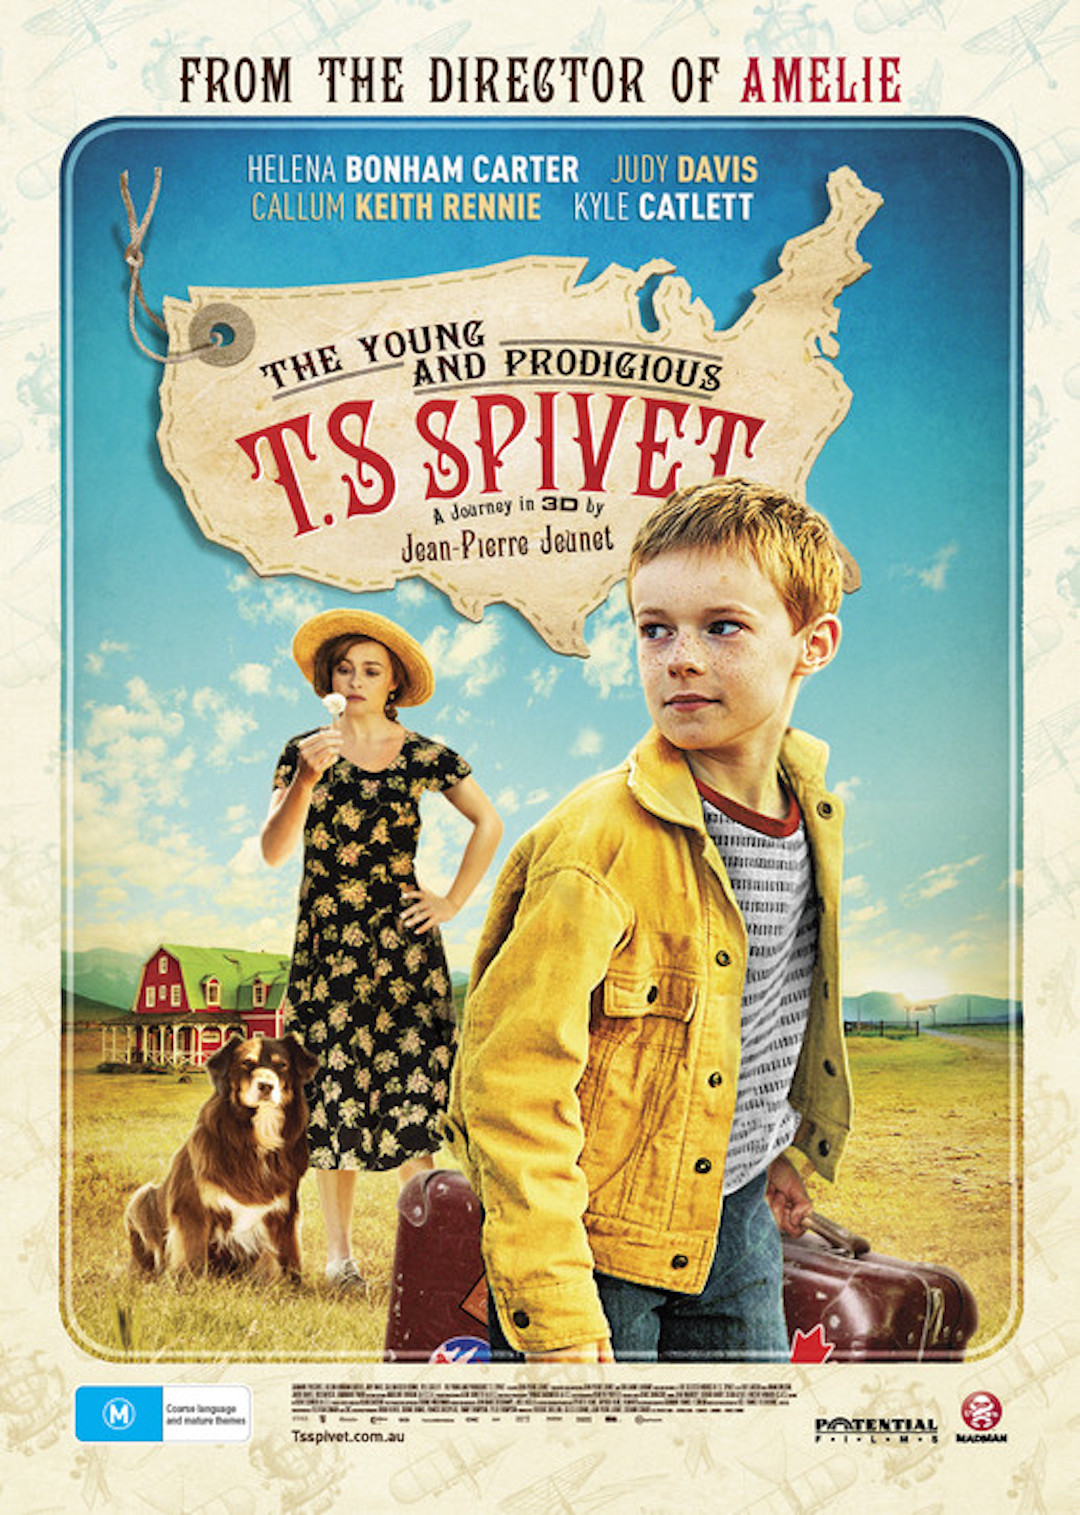
The Young and Prodigious T.S. Spivet (2015)
| Theatrical Performance | ||
| Domestic Box Office | $176,847 | Details |
| International Box Office | $180,840 | |
| Worldwide Box Office | $357,687 | |
| OpusData ID: 228150100 More info... | ||
| Further financial details... | ||
Synopsis
Enter the curious world of T.S Spivet and his lovingly mismatched family who reside on a sprawling ranch near Montana.
Metrics
| Opening Weekend: | $110,295 (62.4% of total gross) |
| Legs: | 1.60 (domestic box office/biggest weekend) |
| Domestic Share: | 49.4% (domestic box office/worldwide) |
| Production Budget: | $33,000,000 (worldwide box office is 0.0 times production budget) |
| Theater counts: | 100 opening theaters/100 max. theaters, 1.5 weeks average run per theater |
| Infl. Adj. Dom. BO | $250,897 |
Movie Details
| Domestic Releases: | July 31st, 2015 (Limited) by Weinstein Co. |
| International Releases: | July 9th, 2015 (Wide) (Hong Kong)
August 27th, 2015 (Wide) (Portugal) |
| Video Release: | November 3rd, 2015 by Lionsgate Home Entertainment |
| MPA Rating: | PG for thematic elements, language and some reckless behavior. (Rating bulletin 2376, 6/2/2015) |
| Running Time: | 105 minutes |
| Film format: | 3-D, 3-D - Shot in 3-D, IMAX: DMR |
| Geographical setting: | Montana, Washington, D.C. |
| Plot point: | Accidental Death, Child Prodigy, Coming of Age, Death of a Sibling, Inventor, Museum, Road Trip, Twins |
| Release detail: | Delayed Release |
| Social setting: | Beauty Pageants |
| Target audience: | Family Movie |
| Source: | Based on Fiction Book/Short Story |
| Genre: | Adventure |
| Production Method: | Live Action |
| Creative Type: | Contemporary Fiction |
| Production/Financing Companies: | Epithete Films, Tapioca Films, Filmarto, Gaumont, France 2 Cinema, Cross Creek Pictures, OCS., France Television |
| Production Countries: | France, Australia, Canada |
| Languages: | English |
Weekend Box Office Performance
| Date | Rank | Gross | % Change | Theaters | Per Theater | Total Gross | Week |
|---|---|---|---|---|---|---|---|
| Jul 31, 2015 | 29 | $110,295 | 100 | $1,103 | $110,295 | 1 | |
| Aug 7, 2015 | 68 | $7,528 | -93% | 30 | $251 | $146,381 | 2 |
| Aug 14, 2015 | 89 | $1,711 | -77% | 9 | $190 | $153,090 | 3 |
| Aug 21, 2015 | 67 | $12,091 | +607% | 11 | $1,099 | $166,437 | 4 |
| Aug 28, 2015 | 86 | $1,886 | -84% | 4 | $472 | $176,149 | 5 |
Daily Box Office Performance
| Date | Rank | Gross | %YD | %LW | Theaters | Per Theater | Total Gross | Days |
|---|---|---|---|---|---|---|---|---|
| Jul 31, 2015 | - | $8,674 | 100 | $87 | $85,311 | 1 | ||
| Aug 1, 2015 | - | $13,696 | +58% | 100 | $137 | $99,007 | 2 | |
| Aug 2, 2015 | - | $11,288 | -18% | 100 | $113 | $110,295 | 3 | |
| Aug 3, 2015 | - | $6,955 | -38% | 100 | $70 | $117,250 | 4 | |
| Aug 4, 2015 | - | $7,488 | +8% | 100 | $75 | $124,738 | 5 | |
| Aug 5, 2015 | - | $6,786 | -9% | 100 | $68 | $131,524 | 6 | |
| Aug 6, 2015 | - | $7,329 | +8% | 100 | $73 | $138,853 | 7 | |
| Aug 7, 2015 | - | $1,914 | -74% | -78% | 30 | $64 | $140,767 | 8 |
| Aug 8, 2015 | - | $3,174 | +66% | -77% | 30 | $106 | $143,941 | 9 |
| Aug 9, 2015 | - | $2,440 | -23% | -78% | 30 | $81 | $146,381 | 10 |
| Aug 10, 2015 | - | $838 | -66% | -88% | 30 | $28 | $147,219 | 11 |
| Aug 11, 2015 | - | $1,566 | +87% | -79% | 30 | $52 | $148,785 | 12 |
| Aug 12, 2015 | - | $1,142 | -27% | -83% | 30 | $38 | $149,927 | 13 |
| Aug 13, 2015 | - | $1,452 | +27% | -80% | 30 | $48 | $151,379 | 14 |
| Aug 14, 2015 | - | $302 | -79% | -84% | 9 | $34 | $151,681 | 15 |
| Aug 15, 2015 | - | $911 | +202% | -71% | 9 | $101 | $152,592 | 16 |
| Aug 16, 2015 | - | $498 | -45% | -80% | 9 | $55 | $153,090 | 17 |
| Aug 17, 2015 | - | $255 | -49% | -70% | 9 | $28 | $153,345 | 18 |
| Aug 18, 2015 | - | $220 | -14% | -86% | 9 | $24 | $153,565 | 19 |
| Aug 19, 2015 | - | $418 | +90% | -63% | 9 | $46 | $153,983 | 20 |
| Aug 20, 2015 | - | $363 | -13% | -75% | 9 | $40 | $154,346 | 21 |
| Aug 21, 2015 | - | $3,096 | +753% | +925% | 11 | $281 | $157,442 | 22 |
| Aug 22, 2015 | - | $5,253 | +70% | +477% | 11 | $478 | $162,695 | 23 |
| Aug 23, 2015 | - | $3,742 | -29% | +651% | 11 | $340 | $166,437 | 24 |
| Aug 24, 2015 | - | $1,796 | -52% | +604% | 11 | $163 | $168,233 | 25 |
| Aug 25, 2015 | - | $1,510 | -16% | +586% | 11 | $137 | $169,743 | 26 |
| Aug 26, 2015 | - | $2,327 | +54% | +457% | 11 | $212 | $172,070 | 27 |
| Aug 27, 2015 | - | $2,193 | -6% | +504% | 11 | $199 | $174,263 | 28 |
| Aug 28, 2015 | - | $281 | -87% | -91% | 4 | $70 | $174,544 | 29 |
| Aug 29, 2015 | - | $805 | +186% | -85% | 4 | $201 | $175,349 | 30 |
| Aug 30, 2015 | - | $800 | -1% | -79% | 4 | $200 | $176,149 | 31 |
| Aug 31, 2015 | - | $299 | -63% | -83% | 4 | $75 | $176,448 | 32 |
| Sep 1, 2015 | - | $125 | -58% | -92% | 4 | $31 | $176,573 | 33 |
| Sep 2, 2015 | - | $105 | -16% | -95% | 4 | $26 | $176,678 | 34 |
| Sep 3, 2015 | - | $169 | +61% | -92% | 4 | $42 | $176,847 | 35 |
Weekly Box Office Performance
| Date | Rank | Gross | % Change | Theaters | Per Theater | Total Gross | Week |
|---|---|---|---|---|---|---|---|
| Jul 31, 2015 | 45 | $62,216 | 100 | $622 | $138,853 | 1 | |
| Aug 7, 2015 | 69 | $12,526 | -80% | 30 | $418 | $151,379 | 2 |
| Aug 14, 2015 | 87 | $2,967 | -76% | 9 | $330 | $154,346 | 3 |
| Aug 21, 2015 | 66 | $19,917 | +571% | 11 | $1,811 | $174,263 | 4 |
| Aug 28, 2015 | 92 | $2,584 | -87% | 4 | $646 | $176,847 | 5 |
Full financial estimates for this film, including domestic and international box office, video sales, video rentals, TV and ancillary revenue are available through our research services. For more information, please contact us at research@the-numbers.com.