October 14th, 2013
It's a good week on the home market with two $100 million hits coming out: The Heat and Pacific Rim. I've heard good things about both films, but unfortunately, neither screener has arrived. Also, while we have two big release on top, there's not a lot of depth and we quickly run into releases that would be filler during a normal week. At the time I started this column, no new releases for the week had arrived on time, but at least that gave me a chance to get a bit caught up on some of the previous late arrivals. This list includes two contenders for Pick of the Week: White Collar: Season Four and Modern Family: Season Four on DVD or Blu-ray. Both are must haves, but the latter won out for Pick of the Week honors.
More...
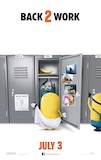
July 15th, 2013
There were two strong new releases this week, but Despicable Me 2 remained on top, even though it fell a little faster than expected. Grown Ups 2 was further evidence that bad reviews actually help Adam Sandler movies. Finally, Pacific Rim struggled, at least compared to its massive production budget. Overall, the total box office was $194 million, which is 15% lower than last weekend. However, last weekend was a holiday weekend, so this is a good hold. Compared to last year, the overall box office was 17% higher, which is a great result. Year-to-date, 2013 is still behind 2012, but by less than 1% at $5.81 billion to $5.86 billion. Unfortunately, next weekend 2013 will have to go against The Dark Knight Rises, so 2013 will likely lose a lot of ground.
More...
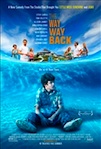
July 9th, 2013
The Way Way Back earned top spot on the per theater chart with an average of $29,094 in nineteen theaters. This suggests a lot of room to expand, while it should reach its first milestone shortly. The overall box office leader, Despicable Me 2 was next with an average of $20,895. Kevin Hart: Let Me Explain was a surprise entrant in the $10,000 club with an average of $11,450 in nearly 900 theaters. The final film in the $10,000 club was Museum Hours with an average of $10,427 in three theaters.
More...
July 9th, 2013
The July 4th long weekend resulted in a delay for some of the final box office numbers, but now that we have them, it was worth the wait. Despicable Me 2 scored an easy win with The Lone Ranger coming in a very, very distant second place. Fortunately, Despicable Me 2 made enough to compensate and the overall box office numbers were very strong. Over the three-day portion of the holiday weekend, $227 million was brought in. This is 19% higher than last weekend and 16% higher than the same three-day weekend last year. (Because July 4th falls on a different day each week, there's no way to compare the full holiday year-over-year.) Year-to-date, 2013 has earned $5.53 billion, which is 2.1% lower than last year's pace. It would only take a couple of solid wins for 2013 to earn the $118 million needed to catch up to 2012, but with The Dark Knight Rises looming ahead, that seems unlikely for now.
More...
July 4th, 2013
It's July 4th, which means it is the Independence Day long weekend, one of the busiest weekends of the year. There are two wide releases looking to compete with the holdovers for box office dollars, but it is clear that Despicable Me 2 has far more box office potential than The Lone Ranger has. Meanwhile, Kevin Hart: Let-Me-Explain should grab a spot in the top ten. Meanwhile, Monsters University, The Heat, and the rest of the holdovers should help the overall box office climb higher than last year.
More...
July 1st, 2013
For the most part, June was a really strong month at the box office with nearly every film either matching expectations, or at least coming close enough to call it a victory. Looking forward, there are a dozen films opening wide in July, more or less. One of them, The Smurfs 2, is opening on a Wednesday, so I'm going to hold off talking about that movie till the August preview. Kevin Hart: Let Me Explain is opening in less than 1000 theaters, but it has a shot at reaching the top ten during its opening weekend. If we include both of them, there are twelve films, but I think it is better to stick with the ten truly wide, truly July openings. Of these, Despicable Me 2 is clearly going to be the biggest hit at the box office. It could become the second biggest hit of the year so far. It is not the only film that could be a $100 million hit. In fact, there are six films opening in July that I think have a better than 50% chance of reaching that level. There is currently only one film that I think won't at least become a midlevel hit. By comparison in 2012, there were three $100 million movies, led by The Dark Knight Rises, but the rest of the new releases struggled. There's no chance any movie opening this month will top $400 million, in fact, it is quite possible no film will get to $300 million. That said, 2013 has a lot better depth, so it might come out on top in the end.
More...