February 26th, 2012
While the Independent Spirit Award unofficially kick off Awards Season with their nominations, they are one of the last to hand out their actual awards, which they did on Saturday. As it has most of the time, The Artist led the way by earning four wins out of the five categories it was nominated it. So which one did it lose? And what were the other winners?
More...
February 23rd, 2012
With our annual Oscar Prediction contest underway, now is the best time to look at the nominees and try and figure out who the favorites are and which films should just feel honored to be nominated. Today we will look at the two writing categories, finishing with Best Original Screenplay. This race could be closer than it looks at first, as differences in rules affected the WGA nominations, but will there be an upset?
More...
January 24th, 2012
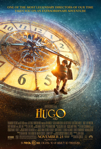
Yesterday was one of the biggest days during Awards Season as The Oscar nominations were announced in the morning. It was a two horse race for top spot as far as the big winners are concerned. Hugo earned the most nominations with eleven, while The Artist was right behind with ten. However, one could argue The Artist is the bigger winner, as more of its nominations were in the more prestigious categories.
More...
December 20th, 2011

It was a busy week on the per theater chart with several films in the $10,000 club. These were led by Mission: Impossible: Ghost Protocol with $30,083, but given its unusual opening, it's hard to judge this start. (More on its IMAX run later today.) Tinker Tailor Soldier Spy expanded from four to sixteen theaters, but remained potent with an average of $28,549. Some measure of mainstream success is guaranteed, even if it is failing to live up to expectations during Awards Season. On the other hand, The Artist is starting to clean up during Awards Season and this is helping its per theater average remain strong at $16,904. It should have no trouble expanding some more, even if the nature of the film will prevent it from becoming a hit in Megaplexes. Carnage debuted with an average of $15,959 in five theaters, which is disappointing given its pedigree. The overall box office leader, Sherlock Holmes: A Game of Shadows, was the final film in the $10,000 club earning an average of $10,704.
More...
December 20th, 2011
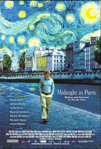
Christmas is less than a week away and there are a few releases that would make great last minute gifts. There are also very few releases overall so expect a short list this week. These great last minute gift ideas include Midnight in Paris on DVD or Blu-ray, Dolphin Tale in 3D Combo Pack and Futurama: Volume Six on DVD or Blu-ray. However, for Pick of the Week, I'm going with Warrior on Blu-ray Combo Pack. It's a great movie and there are plenty of extras on the DVD and the Blu-ray includes a Picture-in-Picture track.
More...
December 18th, 2011
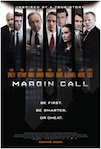
Margin Call opened in limited release in late October in way more theaters than most limited releases debut in, but despite this, it still managed a $10,000 per theater average. It did well enough to expand somewhat, and this past week it cracked $5 million in total. It is now coming out on the home market, but will it continue this success?
More...
November 30th, 2011
As it does every year, Independent Spirit Award nominations kick off the unofficial start of Awards Season. This year there were two films that topped the list of nominations: The Artist and Take Shelter. Both of those films earned five nominations, but they weren't the only films to be singled out.
More...
November 16th, 2011
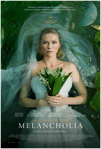
Melancholia led the way on the per theater chart with an average of $13,535 in 19 theaters. It was playing in more theaters than most limited releases debut in, but for a film with Oscar aspirations, this was a weaker result that I would have liked. It also might hurt the film's Oscar chances; after all, people can't vote for films they haven't seen. The overall box office leader, Immortals, placed second with an average of $10,349, which is about $3,000 more than I was expecting.
More...
November 8th, 2011
Like last week, Like Crazy was the only film to reach the $10,000 on the per theater chart. It expanded from four to sixteen theaters, while its per theater average remained strong at $16,657. The only new release that came close to $10,000 was The Other F Word and it was well back with an average of $6,643 in two theaters.
More...
November 1st, 2011
Like Crazy was the only film to reach the $10,000 mark on the per theater chart, but was stellar with an average of $30,785 in four theaters. Its reviews suggest it will be able to expand somewhat, but it's a little too weak to be an Awards Season player. While it didn't get to the $10,000 mark, Ra. One came relatively close to reaching the top ten with $1.65 million in 189 theaters over the weekend for an average of $8,751. That's amazing for this type of film and it deserves a special mention.
More...
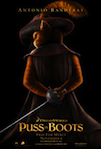
October 30th, 2011
Although it's perhaps an exaggeration to call it the start of the Holiday Season, Puss in Boots' debut this weekend was intended to give Dreamworks Animation a head start on what will be a very competitive season, and it looks as though it can be called a moderate success. The Shrek spin-off will earn an estimated $34 million this weekend, which should put it on track to earn comfortably over $100 million during its run in domestic theaters. While that's a very respectable performance for October, it pales in comparison to other films in the franchise. Even Shrek Forever After more than doubled that number, and the original Shrek posted over $42 million in 2001. So it's far from certain that this will be the start of a long-lived offshot for the franchise.
More...
October 25th, 2011
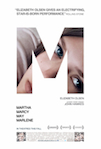
Martha Marcy May Marlene was one of five films to top $10,000 on the per theater chart leading the way with $34,413. Combining the film's opening with its reviews and it suggests serious potential for expansion. Being Elmo: A Puppeteers Journey opened with $22,963 in its lone theater, which is surprisingly strong. The overall box office leader, Paranormal Activity 3, was next with $15,829. Last week's winner on the per theater chart, The Skin I Live In, remained strong with an average of $11,771 in 21 theaters. Further expansion is likely, as it is earning some measure of mainstream success, but its bizarre subject matter will prevent it from truly escaping the art house circuit. Margin Call was a surprise entrant in the $10,000 club, as it was playing in 56 theaters, which is a lot for a limited release. Its opening weekend average of $10,034 and excellent reviews suggests some potential to expand, while reaching $1 million should happen sometime during the upcoming weekend.
More...
October 23rd, 2011
After a poor September and slow start to October, Paranormal Activity 3 put some life back in to the movie industry this weekend with a huge $54 million opening weekend, according to Paramount's Sunday estimate. That's comfortably a record for the franchise and will almost certainly top Jackass 3D to become the biggest October's biggest weekend too. With no other horror flick coming out between now and Halloween, it should be set for a comfortable $100 million or so at the box office (on a budget of $5 million).
More...
October 21st, 2011
This week more than a dozen limited releases are being released, which is far too many. This level of competition means even films with great reviews, high name recognition among the cast, and strong advance buzz could struggle to find an audience. There are a number of films that have at least two of those three key ingredients, including Martha Marcy May Marlene and Oranges and Sunshine. Hopefully these two, and a few others, will find a receptive audience in limited release.
More...