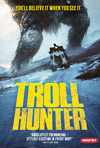
Synopsis
The government says there’s nothing to worry about—it’s just a problem with bears making trouble in the mountains and forests of Norway. But local hunters don’t believe it—and neither do a trio of college students who want to find out the truth. Armed with a video camera, they trail a mysterious “poacher,” who wants nothing to do with them. But their persistence lands them straight in the path of the objects of his pursuits: Trolls. They soon find themselves documenting every move of this grizzled, unlikely hero—The Troll Hunter—risking their lives to uncover the secrets of creatures only thought to exist in fairy tales.
Metrics
| Opening Weekend: | $5,585 (2.2% of total gross) |
| Legs: | 6.21 (domestic box office/biggest weekend) |
| Domestic Share: | 4.4% (domestic box office/worldwide) |
| Production Budget: | $3,500,000 (worldwide box office is 1.6 times production budget) |
| Theater counts: | 1 opening theaters/21 max. theaters, 7.4 weeks average run per theater |
| Infl. Adj. Dom. BO | $344,529 |
Latest Ranking on Cumulative Box Office Lists
| Record | Rank | Amount |
|---|---|---|
| All Time Domestic Box Office (Rank 11,101-11,200) | 11,117 | $253,444 |
| All Time International Box Office (Rank 6,201-6,300) | 6,263 | $5,453,194 |
| All Time Worldwide Box Office (Rank 9,501-9,600) | 9,513 | $5,706,638 |
| All Time Domestic Highest Grossing Limited Release Movies (Rank 3,301-3,400) | 3,329 | $253,444 |
See the Box Office tab (Domestic) and International tab (International and Worldwide) for more Cumulative Box Office Records.
Watch Now On
| iTunes: | iTunes |
| Google Play: | Google Play |
Movie Details
| Domestic Releases: | June 10th, 2011 (Limited) by Magnet Pictures, released as Troll Hunter |
| International Releases: | August 16th, 2012 (Wide) (Peru) |
| Video Release: | August 23rd, 2011 by Magnolia Home Entertainment, released as Trollhunter |
| MPAA Rating: | PG for some sequences of creature terror. (Rating bulletin 2167, 4/13/2011) |
| Running Time: | 90 minutes |
| Comparisons: | vs. Witchboard Create your own comparison chart… |
| Keywords: | Cryptozoology, Mockumentary, Cover Up, Conspiracy Theory, Found Footage, Based on an UNTRUE Story, Cinema Verite, Horror Comedy, Supernatural |
| Source: | Original Screenplay |
| Genre: | Horror |
| Production Method: | Live Action |
| Creative Type: | Contemporary Fiction |
| Production/Financing Companies: | Filmkameratene AS, Filmfondet Fuzz, SF Norge AS |
| Production Countries: | Norway |
| Languages: | Norwegian |