September 14th, 2004
The Village again was the weekend champ in the international box office with $15.3 million on nearly 3,500 screens in 31 markets. Highlights for the weekend include and impressive debut in Germany at $5.5 million and a less spectacular $3.1 million in Japan. The film also suffered a 55% drop-off in its second weekend in Australia while it held up much better in Brazil. So far the film has earned $63.2 million internationally and is well on its way to matching its $112 million domestic total.
More...
August 31st, 2004
As the summer box office comes to a close,
The Village continues to set career best records for
M. Night Shyamalan, but it's the sophomore stint drop-offs that the real story. The previously mentioned career best openings were in Belgium, Sweden and Norway totaled $2.6 million, but at the same time saw its U.K. and French numbers cut nearly in half from last weekend. This week it took in a total of $10.2 million in 14 markets, lifting its international total to $30.8 million
More...
July 19th, 2004
Every week films get a second chance at success from the home market; or, in some cases, a first chance at success. Here is a list of wide releases, limited releases and a few from the growing TV on DVD section. It's a strange week as several of this week's releases are on the
Amazon Sales Chart, but none that stuck out as a must have. So for the second week in a row no DVD is being selected as the DVD Pick of the Week. Next week things pick up, and every week in August there's a least one DVD that's a must have. And there's so many good DVDs coming out in September that I'll have to sell a second kidney to buy them all.
More...
May 4th, 2004
After a huge start in the international market, there was a series a steep drops for
Kill Bill: Volume 2 that all but guarantees it won't earn as much as
the original. Drops like 51% in Germany, 46% in Italy helped push the weekend total down to just $10 million in 27 markets.
More...
April 27th, 2004
Kill Bill: Volume 2's first foray into the foreign markets proved very profitable. The film earned $18.5 million in 21 markets and increases compared to the debut of the
original in all but one market. Many of those increases were in the double-digit range so it's an impressive start. Unfortunately, one of the largest markets for the first film, Japan, saw a huge 47% drop for Volume 2. This can easily be explained by the fact that half of Volume 1 took place in Japan.
More...
April 20th, 2004
The Passion of the Christ saw large drop-offs in many international markets but openings in nine others helped stabilize its overall box office. Maybe. I'm getting some conflicting reports on the box office figures. $14.6 or $25 is the two prevailing estimates I've found. I do believe the $25 million is for the whole week while the $14.6 million is for the weekend.
More...
April 13th, 2004
It was hardly a surprise that
The Passion of the Christ was able to take top spot over Easter weekend. What is a surprise is the amount; just $26 million is barely an increase from last weekend. There was only one new opening, but it was in Italy, one of the most staunchly Catholic nations. The film did cross $100 million internationally some time during the mid-week, but a serious post-Easter drop-off is expected.
More...
April 6th, 2004
Another 7 openings helped keep The Passion of the Christ in top spot with $25.4 million. And the same pattern is holding true, the smaller the market the better the result. In Spain it opened to $3.2 million, about on par with Gothika's opening at the end of February. In South Korea it opened first with $2.3 million, significantly below the local productions that have been taking tops spot for most of the year. So far the film has earned just over $80 million internationally and over $400 million worldwide.
More...
March 30th, 2004
With no new wider releases the top five international box office finished in the same order as last weekend.
The Passion of the Christ again topped the week thanks to number one openings in many markets and even a few records. The biggest slice of its estimated $16 million take came from the U.K. where it finished first, sort of. Including previews its $3.6 was strong enough for first place; if you don't include previews then it drops to third place behind the debut of
Dawn of the Dead and the second weekend of
Starsky and Hutch. The film again had strong results in small markets breaking records in Argentina and Venezuela. Total international run now sits at $58.7 million in 36 markets, good, but certainly not comparable to its domestic total.
More...
March 23rd, 2004
The Passion of the Christ had mixed openings during its fourth weekend in international release. In Latin America is performed very well, where it made two thirds of its $15 million weekend take, breaking records in Chile and Central America along the way. On the flip side it could only manage a paltry $2.3 million in Germany, half of first place
Brother Bear and on par with
Gothika's opening earlier in the year. It would have been more impressive if the situation was reversed. After all, record breaking performances throughout Latin American won't earn as much as a blockbuster performance in Germany. Overall Passions has pulled in $32.3 million in 19, mostly smaller markets.
More...
March 22nd, 2004
For the first time this year we saw a substantial increase over the box office from this time last year that wasn't due to a single movie. This week we saw a token 1.4% increase from last weekend, but a fantastic 21.5% increase from last year. It is important to keep in mind, however, that Spring was the weakest point in 2003's box office if you take into account Seasonal Adjustments. This weekend last year was when the war in Iraq started, for instance, and this weakness continued till mid-April. So 2004 has a golden opportunity to put some distance between itself and 2003.
More...
March 19th, 2004
With three movies opening wide we should see a change at the top spot this week. But there are a couple of twists. Firstly, all three movies are rated R, which should help more kid friendly fare at the box office. Secondly, the movie with the best reviews is also opening in the fewest theatres.
More...
March 16th, 2004
It may have not made it in the Top Five so far in its run, but there's enough interest in
The Passion of the Christ's performance that it warrants a mention.
More...
March 15th, 2004
It was the third weekend in a row with week-to-week drop-offs, this time it was 18.8%, which is huge for non-post holiday weekend. And only the weakness experienced this time last year is keeping 2004 above 2003's pace. This weekend it was up 10% helping the year-to-date gain increase to nearly 4%. Still not higher than inflation, but it's much better than earlier in the year.
More...
March 12th, 2004
2004 is starting to slow down again, as this week's group of new movies is quite weak. The only wide release with overall positive reviews really stretches the definition of wide release. And the other two releases have reviews that range from mediocre to really bad.
More...
March 8th, 2004
Another good news bad new weekend. Bad news, the total box office was down 8% from last weekend. Good new, it was up 31% from last year. Good news, 2004 has finally surpassed 2003 year-to-date. Bad news, that's due to inflation as admissions are still lower. Really bad news, the jump is thanks entirely to one movie, or the controversy surrounding one movie.
More...
March 5th, 2004
We haven't seen two film open with strong prospects since the beginning of February. And with last week's winner still going strong, 2004 should pass 2003 at the box office.
More...
March 4th, 2004
During the past week promotional websites for several movies were launched and some older ones added additional content. Here the list of this week's releases, a couple of new sites and few updates including the winner for the week,
The Prince & Me -
Official Site . If you know of any new movie websites not on this list feel free to e-mail me with the details.
More...
March 1st, 2004
Every week films get a second chance at success from the home market; or, in some cases, a first chance at success. Here is a list of wide releases, limited releases and a few from the growing TV on DVD section. A bit of a slow week, which means I was able to reduce my choices for DVD pick of the week to just one:
School of Rock - (
Buy from Amazon.) I'm not counting
Father Ted - The Holy Trilogy, because it was one of my Picks of the Week when it was originally supposed to be released.
More...
February 20th, 2004
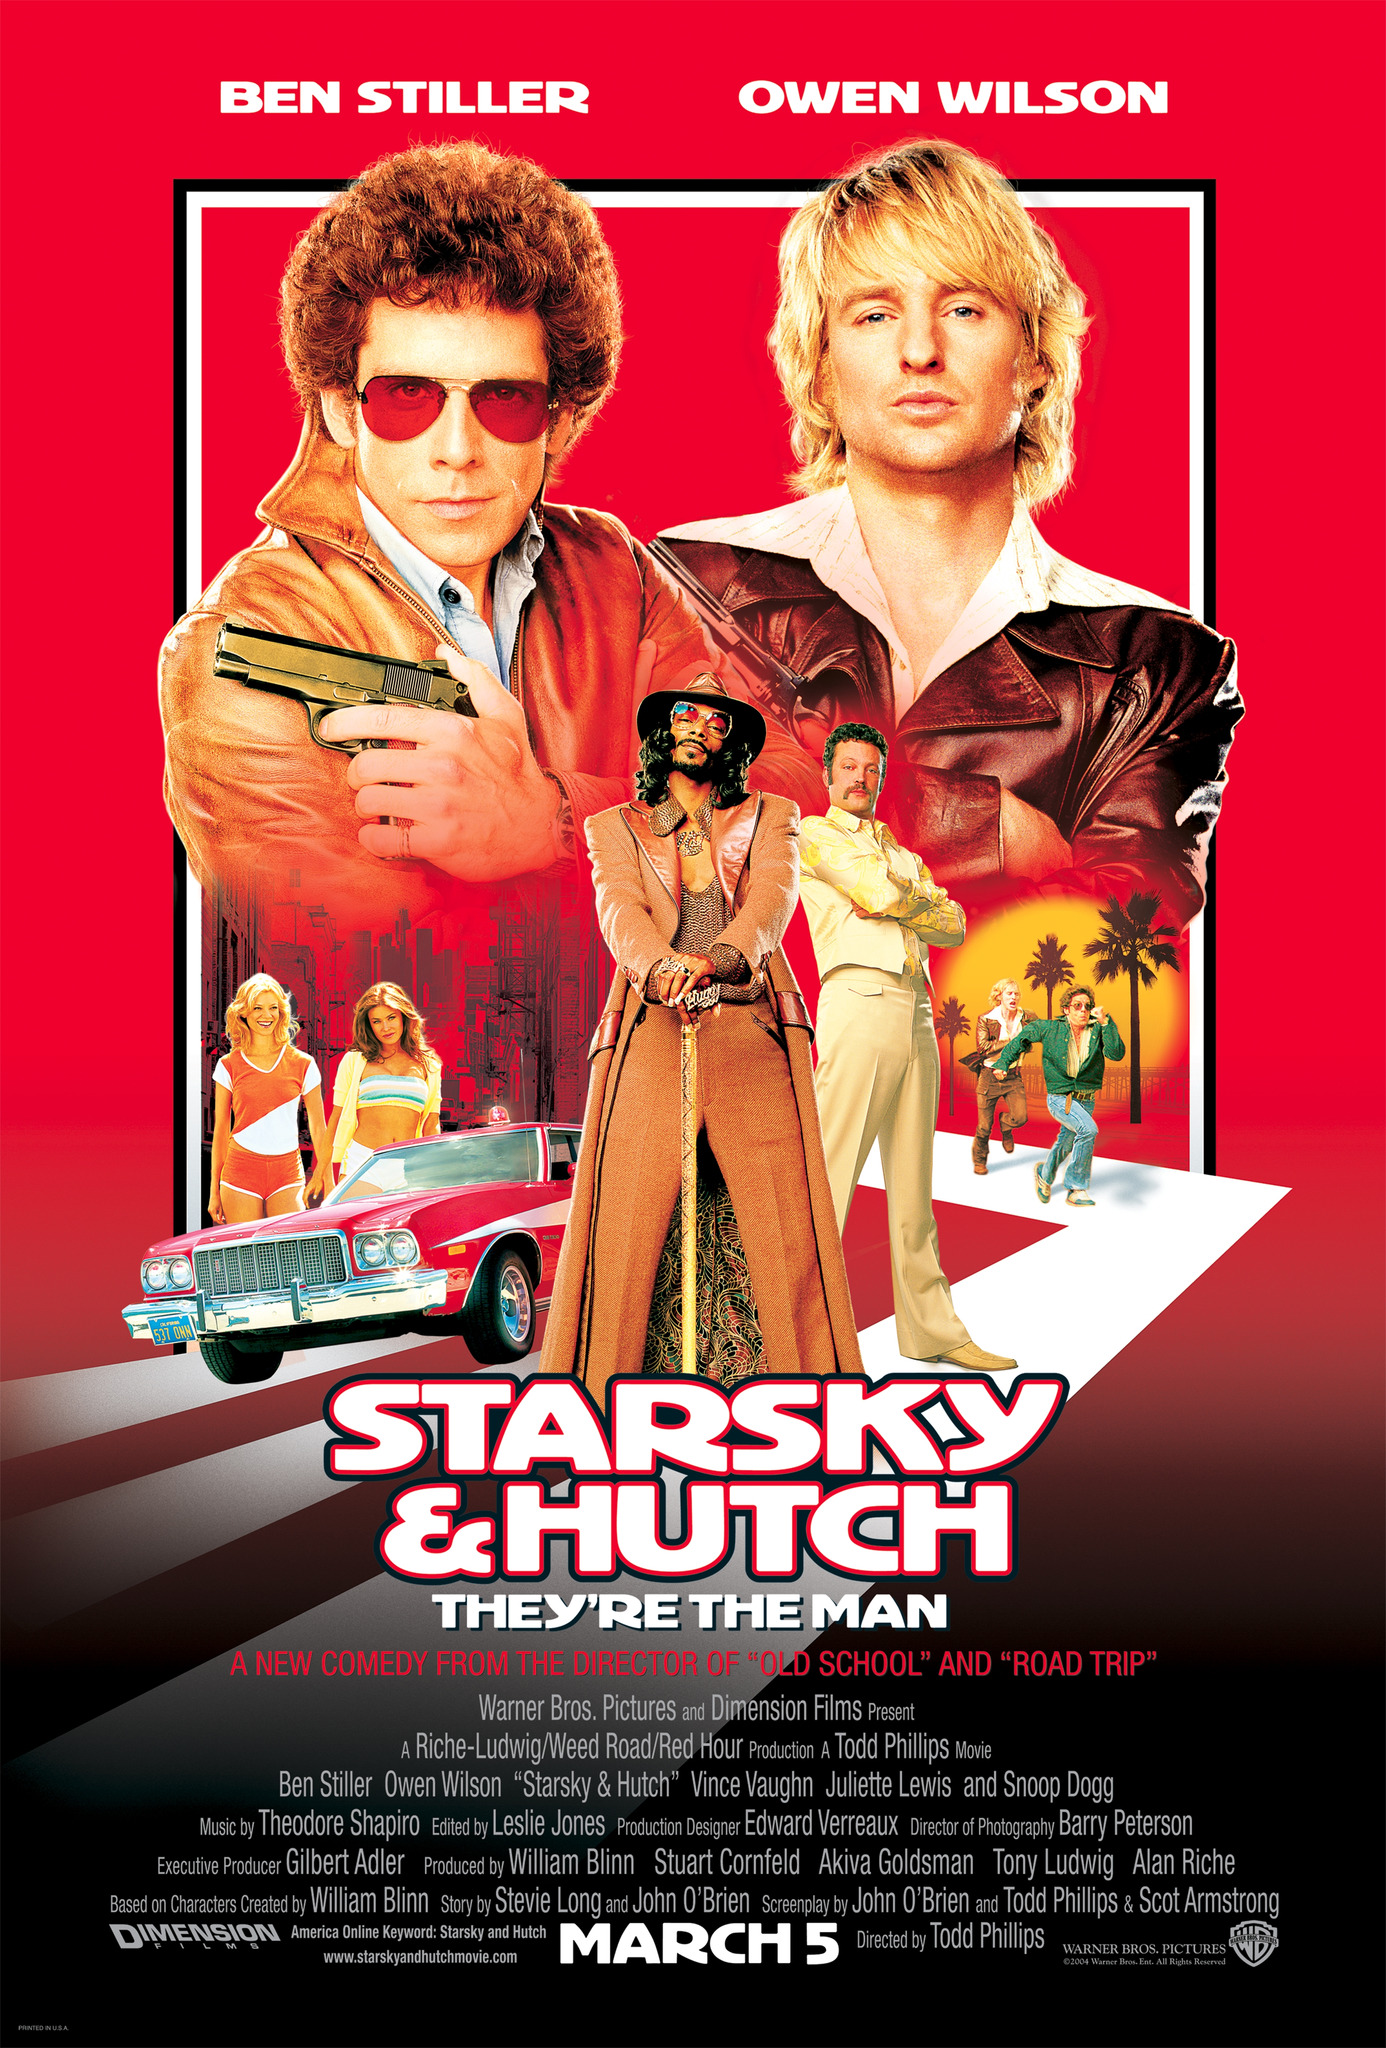
Two movies with March releases have previews this weekend. First up is
The Girl Next Door, which is showing in 831 theatres tonight before opening wide March 12th. Tomorrow the remake of the classic 70s show
Starsky and Hutch will play in 850 theatres. It opens wide on March 5th.
More...
February 19th, 2004
During the past week promotional websites for several movies were launched and some older ones added additional content. Here the list of this week's releases, a couple of new sites and few updates including the winner for the week,
Confessions of a Teenage Drama Queen -
Official Site . If you know of any new movie websites not on this list feel free to e-mail me with the details.
More...
February 12th, 2004
During the past week promotional websites for several movies were launched and some older ones added additional content. Here the list of this week's releases, a couple of new sites and few updates including the winner for the week,
Eternal. If you know of any new movie websites not on this list feel free to e-mail me with the details.
More...
February 6th, 2004
During the past week promotional websites for several movies were launched and some older ones added additional content. Here the list of this week's releases, a couple of new sites and few updates including the winner for the week.
Miracle -
Official Site. If you know of any new movie websites not on this list feel free to e-mail me with the details.
More...
January 22nd, 2004
During the past week promotional websites for several movies were launched and some older ones added additional content. Here the list of new releases, updated sites, and some upcoming releases that slipped through the cracks, including the winner for the week Win a Date with Tad Hamilton! - Official Site . If you know of any new movie websites not on this list feel free to e-mail me with the details.
More...
January 8th, 2004
During the past week promotional websites for several movies were launched and some older ones added additional content. This week we have a larger list to make up for the holidays, but a winter storm took out my internet access on Tuesday / Wednesday so the column is a little late today. Here the list of new releases, updated sites, and some upcoming releases that slipped through the cracks, including the winner for the week Along Came Polly - Official Site . If you know of any new movie websites not on this list feel free to e-mail me with the details.
More...
December 4th, 2003
During the past week promotional websites for several movies were launched and some older ones added additional content. Here's a list of highlights, plus one last look at websites for films opening this week.More...