Weekend projections: You Can See Everything and Clayface neck-and-neck as Halloween exceeds expectations
November 1, 2026

We can’t tell you whether more people dressed as Elizabeth Holmes at Halloween parties or saw her on the big screen last night, but we know this morning that the Halloween weekend is coming in well ahead of what the model expected on Friday. You Can See Everything is expected to top the weekend chart with $10.6 million, according to A24’s Sunday-morning projection, edging Clayface by about $200,000 in its third weekend of release. Warner Bros. isn’t conceding: its weekend report bills Clayface as No. 1 in North America for the second weekend running, even though its own $10.4 million projection is the lower of the two. Clayface is the clear winner worldwide, with $22.8 million, but with 2% separating them domestically, Monday’s actuals will settle the race at home. If A24’s number holds, You Can See Everything would be only the fourth documentary to finish a weekend at No. 1, and the first to do it after its opening weekend. The top ten should take $47.0 million, 30% more than we predicted, and down 45% from last weekend, but 6% ahead of this weekend in 2025.
Here are the official studio projections for the weekend (click the image for a full chart of all films reporting so far).
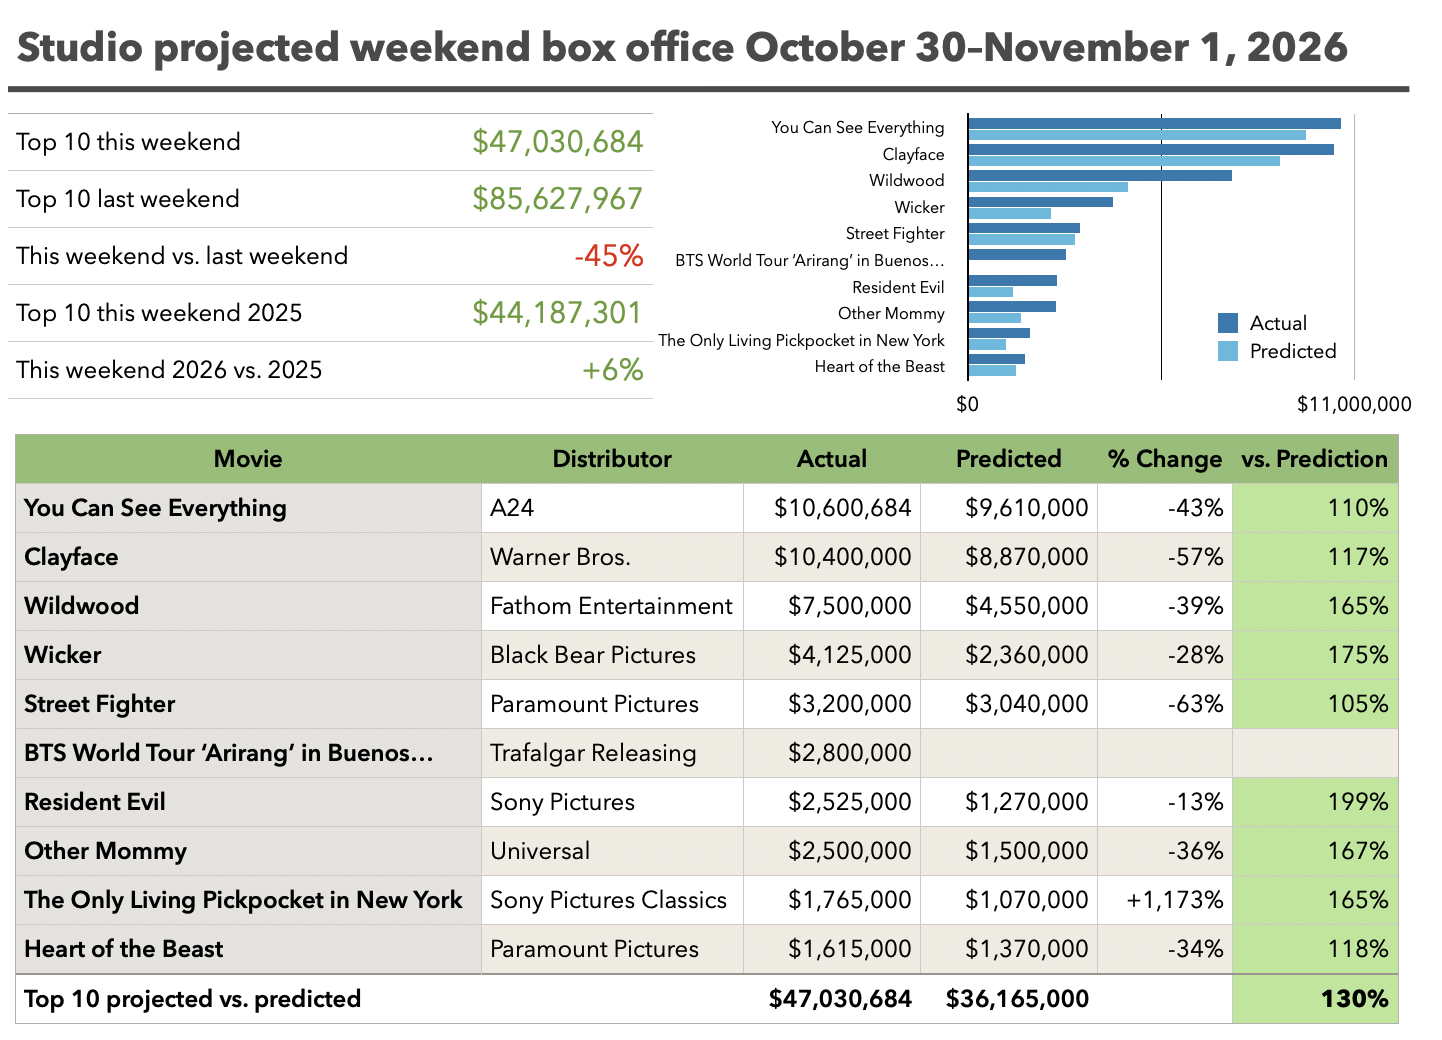
You Can See Everything took $3.58 million on Saturday, level with Friday, and A24 expects $3.45 million on Sunday. The projected weekend is down 43% from last weekend, despite 588 more theaters, 10% ahead of our Friday-morning prediction and 4% below the model’s figure on Saturday morning. It would take the film to $63.9 million, and past In Search of Noah’s Ark on the all-time documentary list. Of documentaries made for regular cinemas rather than IMAX, only Fahrenheit 9/11, March of the Penguins and Michael Jackson’s This Is It have earned more.
Halloween was kind to Clayface, which rose 29% on Saturday to $4.3 million, the biggest Friday-to-Saturday increase in the top ten. Warner Bros. projects $10.4 million for the weekend, down 57% and 17% ahead of our prediction, which would take it to $44.1 million domestically. Warner Bros. is claiming top spot, based on their projection for You Can See Everything, and the two movies are certainly within the margin of error of one another. Abroad, Clayface should add $12.4 million from 80 markets, down 34%, for $38.9 million internationally, led by $6.1 million from the UK, and $83.0 million worldwide.
Family films were expected to suffer most from trick-or-treating, but Laika’s Wildwood took $2.7 million on Saturday, up 12% on Friday and down just 36% from its opening Saturday. Fathom projects $7.5 million, down 39%, 65% more than we predicted on Friday morning and 4% ahead of the model on Saturday. That would take it to about $25.8 million. Audiences continue to love it: 97% rated it excellent or very good in PostTrak’s polling over Friday and Saturday.
Wicker had one of the best holds of the weekend, falling just 28% to $4.125 million as Black Bear expanded it to 2,374 theaters. That is 75% more than we predicted, and would take it to $13.3 million. It is also set to open at No. 1 in the UK, with $2.2 million from 676 theaters, or $2.3 million including previews.
Street Fighter is expected to take fifth with $3.2 million, down 63% and 5% ahead of our prediction, for $53.0 million domestically. With $3.2 million more from 65 international markets, it should reach $38.9 million internationally and $91.9 million worldwide. Trafalgar’s BTS World Tour ‘Arirang’ in Buenos Aires and São Paulo Live Viewing is projected at $2.8 million, enough for sixth place.
Resident Evil should fall just 13% to $2.525 million, almost double our prediction, for $157.4 million domestically. Abroad, it should add $7.5 million from 66 markets, down 29%, taking it to $242.6 million internationally and $400.0 million worldwide, the most for any film in the franchise. Universal projects $2.5 million for Other Mommy, down 36% and 67% ahead of our prediction, for $55.6 million. It expanded into ten more international markets, led by Germany, where it should open in second place with $1.5 million, and should reach $51.8 million internationally and $107.5 million worldwide.
Sony Pictures Classics’ The Only Living Pickpocket in New York is projected at $1.765 million from 1,112 theaters, after expanding from six, which would put it ninth. Heart of the Beast completes the top ten with $1.615 million, down 34%, for $65.1 million domestically. It is set to open at No. 2 in South Korea with $1.6 million, part of a $5.2 million international weekend that would take it to $115.9 million internationally and $181.0 million worldwide.
Just outside the top ten, Sense and Sensibility is projected at $1.4 million, down 58%, for $16.8 million domestically and $37.2 million worldwide, and Verity at $1.32 million, down 57%, for $74.2 million domestically and $172.5 million worldwide. Whalefall should take $1.05 million, for $16.4 million, and Disney’s Everest: The Other Side should open with $1.0 million from 515 theaters, 65% of it from IMAX screens. Among the other new releases, Roadside Attractions projects $757,600 for Sight & Sound Presents: JOSHUA Live! from 1,230 theaters, Samuel Goldwyn $480,000 for The Mongoose from 1,014, and Netflix $455,000 for The Mosquito Bowl from 349. Abroad, The Odyssey should add $2.7 million, for $1.174 billion internationally, passing Furious 7 to become Universal’s biggest film ever outside North America, and $1.799 billion worldwide.
The top ten should total $47.0 million, 30% more than we predicted for the same ten films, with Wildwood, Wicker, Other Mommy and Resident Evil all beating our numbers by more than 60%. That would be down 45% from last weekend’s $85.6 million, but 6% ahead of the same weekend in 2025, and nowhere near the weakest weekend since February 2024 that we thought possible on Friday morning. Actuals follow on Monday.
As usual, we’ll post numbers as soon as we receive them through the week, and, if you need a head start on the numbers for upcoming movies, The Numbers Business Report has predictions and tracking for all movies coming up in the next 12 months, and our weekly subscription option puts you first in line for our detailed weekend predictions on Friday morning.
Bruce Nash, bruce.nash@the-numbers.com.
Weekend update: You Can See Everything should top $10 million as Halloween weekend exceeds expectations
October 31, 2026

You Can See Everything took $3.6 million on Friday from 3,243 theaters and looks set for about $11.0 million over the weekend, enough to give A24’s documentary its first weekend at No. 1, in its third week of release. Clayface took $3.3 million and should finish a close second with about $10.5 million. Halloween is taking less out of the weekend than the model feared: the ten biggest films reporting are on course for about $45.9 million, 32% more than we predicted, though still down 46% from last weekend.
You Can See Everything’s Friday was down 42% from last week, despite 588 more theaters. In 2009 and 2015, the last two years when Halloween fell on a Saturday outside the pandemic, holdovers took about 5% less over the weekend, relative to their Friday, than they had the week before. Allowing for that, a typical third weekend gives $11.7 million, and the film’s own pattern last weekend, when it took 3.05 times its Friday, gives $10.3 million. Splitting the difference puts it at $11.0 million, which would take it to about $64.3 million through Sunday, and make it only the fourth documentary to top the weekend chart, after Fahrenheit 9/11, Michael Jackson’s This Is It, which did it on Halloween weekend in 2009, and last year’s Taylor Swift: The Official Release Party of a Showgirl. All three did it on their opening weekend.
Clayface’s Friday was down 69% from its opening day, or 54% without last week’s $3.5 million in Thursday previews. A typical second weekend, adjusted for the holiday, gives $10.5 million, down 56%, for a running total of $44.2 million. That’s pretty good for a franchise super hero movie, although this isn’t a typical example of such a movie.
Family films take the biggest hit when Halloween falls on a Saturday. In 2009 and 2015 they took about 16% less over the weekend, relative to Friday, than the week before. Wildwood took $2.4 million on Friday from 2,909 theaters, down 45%, or 18% without last week’s previews and Fan First screenings, and on that basis should take about $7.2 million, down 41%. That is at the bottom of Fathom’s $7 million to $8 million range, but 59% more than we predicted, and would take it to $25.6 million.
Black Bear is projecting $4.0 million for Wicker, down just 30% as it expands into 2,374 theaters and 69% more than we predicted. That would take it to $13.1 million. Paramount has Street Fighter at $3.5 million, down 59%, for $53.3 million, and Sony has Resident Evil at $2.3 million, down 21%, for $157.2 million. Universal is projecting $2.25 million for Other Mommy, down 42%, for $55.4 million.
Sony Pictures Classics expanded The Only Living Pickpocket in New York from six theaters to 1,112, and it took $870,000 on Friday, which points to about $2.0 million for the weekend. Verity should take about $1.5 million, down 50%, enough for tenth place. Paramount is projecting $1.5 million for Heart of the Beast, down 38%, for $65.0 million, just outside the top ten, with Focus’s Sense and Sensibility behind it at $1.4 million. Whalefall took $324,000 on Friday and should take about $1.1 million, down 65%.
The one new release expected to reach the top ten is Trafalgar’s concert event BTS World Tour ‘Arirang’ in Buenos Aires and São Paulo Live Viewing, though we don’t yet have official numbers for it. None of the weekend’s other new releases is heading for the top ten. Briarcliff’s Christmas at the Kringles took $370,000 from 1,825 theaters, and the distributor is projecting $675,000 for the weekend, with Saturday down 55% from Friday. Roadside Attractions is projecting $876,385 for Sight & Sound Presents: JOSHUA Live!, after a $264,569 Friday from 1,230 theaters, and Disney’s Everest: The Other Side took $400,000 from 515.
Not counting the BTS concert, the top ten should take about $45.9 million between them, 32% more than the $34.7 million we predicted, down 46% from last weekend’s $85.6 million and 4% ahead of the same weekend in 2025. That makes for a quiet weekend, but nowhere near the low point of February 2024 that we thought possible on Friday morning.
Studio projections for the full weekend will follow on Sunday.
Bruce Nash, bruce.nash@the-numbers.com.
Weekend predictions: Saturday Halloween points to slowest weekend since early 2024, with You Can See Everything set to take top spot
October 30, 2026

Halloween falls on a Saturday this year, and theaters are bracing for one of the slowest weekends in almost three years. The holiday usually takes about a quarter off the box office, and with trick-or-treating and parties landing on the busiest night of the week, our model expects the top ten to take just $34.7 million, down 59% from last weekend and 21% below the same weekend in 2025. With the rest of the chart added, that would be the weakest weekend for all films combined since February 9, 2024, when Argylle topped the chart with just $6.2 million.
The biggest question of the weekend is how well You Can See Everything holds up as A24 expands it from 2,655 theaters to 3,243. All signs point to a first weekend at No. 1 for the documentary. It out-grossed Clayface on Wednesday and Thursday, and came within $15,000 of it on Monday, from 800 fewer theaters, taking it to $53.3 million through Thursday. Our model has it at $9.6 million, down 49% from last weekend’s $18.7 million, and ahead of Clayface, which should fall 63% to $8.9 million. Whether it tops $10 million will come down to how much the holiday cuts into its daily grosses. We expect Saturday to be down about 45% from a typical Saturday.
Last year, with Halloween on a Friday, the weekend fell 27% for all films combined. In 2015, the last time it fell on a Saturday outside the pandemic, the drop was 28%.
Here’s how the model thinks the full top ten will shape up:
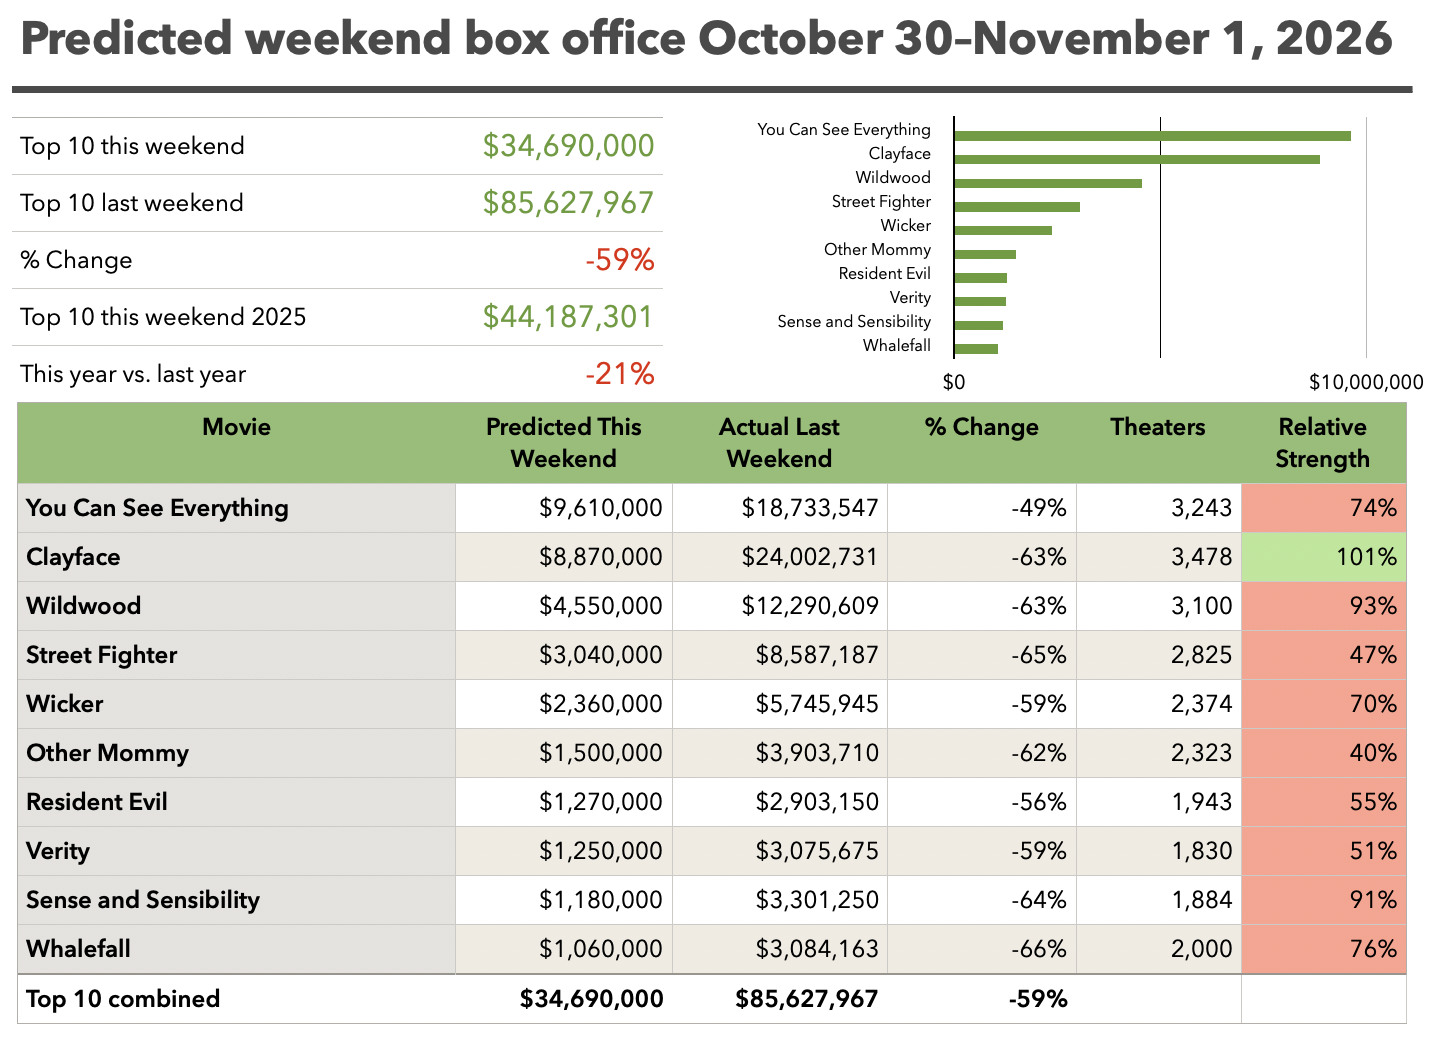
Family films lose their biggest day to trick-or-treating, and Laika’s Wildwood is expected to fall 63% to $4.6 million despite adding about 500 theaters. Street Fighter should take fourth with $3.0 million, down 65%, and Wicker is expected to fall 59% to $2.4 million, even as Black Bear widens it from 1,471 theaters to 2,374. Below them, Other Mommy, Resident Evil, Verity and Sense and Sensibility are all expected to take between $1.2 million and $1.5 million, and Whalefall should hold on to tenth place with about $1.1 million.
Neither of the weekend’s two widest new releases is expected to reach the top ten. Briarcliff opens the holiday horror-comedy Christmas at the Kringles in 1,825 theaters, and Roadside Attractions has the filmed stage show Sight & Sound Presents: JOSHUA Live! in 1,230.
As usual, we’ll post numbers as soon as we receive them through the weekend, and, if you need a head start on the numbers for upcoming movies, The Numbers Business Report has predictions and tracking for all movies coming up in the next 12 months, and our weekly subscription option puts you first in line for our detailed weekend predictions on Friday morning.
Bruce Nash, bruce.nash@the-numbers.com.
Theater counts: Clayface stretches to widest release in second weekend
October 29, 2026
Newcomer Clayface edged out You Can See Everything at last weekend’s box office, a closer contest than seemed likely a few weeks ago, thanks to the documentary’s exceptional hold. Clayface opened with $24.0 million from 3,458 locations, while You Can See Everything earned an estimated $19.5 million from 2,655 theaters in its second weekend. With no major tentpole releases entering the marketplace this weekend and both films expanding their theater counts, the pair appear well positioned to remain atop the box office charts. Laika’s Wildwood adds 504 locations this weekend, while Wicker expands by 903 to 2,374 theaters, the biggest increase on the chart.
Leading this weekend’s newcomers by theater count is Christmas at the Kringles, a holiday horror-comedy about a family whose move to the suburbs takes a dark turn when they discover their Christmas-celebrating neighbors may have more than seasonal cheer on their minds. The film stars Ron Livingston, Rachel Bilson, Rob Riggle, Arden Myrin, Donald Faison, and Thomas Lennon, and launches in 1,825 locations this weekend.
Also opening wide is Sight & Sound Presents: JOSHUA Live!, which adapts the biblical tale of Joshua for the big screen through a filmed version of the popular live stage spectacular. The faith-based event will open in 1,230 North American locations.
Rounding out the weekend’s new releases are Breeder, which launched on Wednesday in 777 locations; Everest: The Other Side (515 theaters); The Irregular at Magic High School THE MOVIE -Yotsuba Succession Arc- debuting in 404 theaters; and the documentary Paging Hezbollah (260).
Looking ahead, next weekend’s release calendar is packed with a diverse slate of newcomers. Among the titles set to arrive are the 1970s-set dark comedy Wild Horse Nine, the Jimmy Stewart biopic Jimmy, Revolutionary War musical Drummer Boy, the Godzilla Minus One follow-up, Godzilla Minus Zero, Indian action epic Ramayana, and The Cat in the Hat. The latter two titles are expected to launch in approximately 1,000 and 4,000 theaters, respectively.
Theater counts for October 30
| Movie | Distributor | Theaters | Previous
Theaters | Change |
|---|
| Clayface | Warner Bros. | 3,478 | 3,458 | +20 |
| You Can See Everything | A24 | 3,243 | 2,655 | +588 |
| Wildwood | Fathom Entertainment | 3,100 | 2,596 | +504 |
| Street Fighter | Paramount Pictures | 2,825 | 3,575 | -750 |
| Wicker | Black Bear Pictures | 2,374 | 1,471 | +903 |
| Other Mommy | Universal | 2,323 | 2,798 | -475 |
| Whalefall | 20th Century Studios | 2,000 | 3,065 | -1,065 |
| Resident Evil | Sony Pictures | 1,943 | 2,148 | -205 |
| Sense and Sensibility | Focus Features | 1,884 | 2,571 | -687 |
| Verity | Amazon MGM Studios | 1,830 | 2,442 | -612 |
| Christmas at the Kringles | Briarcliff Entertainment | 1,825 | | New |
| Heart of the Beast | Paramount Pictures | 1,695 | 2,260 | -565 |
| Sight & Sound Presents: JOSHUA Live! | Roadside Attractions | 1,230 | | New |
| Forgotten Island | Universal | 961 | 1,583 | -622 |
| Klara and the Sun | Sony Pictures | 880 | 880 | |
| Breeder | IFC Entertainment Group | 777 | | New |
| Everest: The Other Side | Walt Disney | 515 | | New |
| Practical Magic 2 | Warner Bros. | 411 | 147 | +264 |
| The Irregular at Magic High School THE MOVIE -Yotsuba Succession Arc- | Sony Pictures | 404 | | New |
| Paging Hezbollah | Hammond Entertainment | 260 | | New |
| Once Upon a Time in Hollywood | Sony Pictures | 252 | | Re-issue |
| Ken Russell’s The Devils | Warner Bros. | 217 | 315 | -98 |
| Primetime | A24 | 177 | 321 | -144 |
| Your Mother, Your Mother, Your Mother | Amazon MGM Studios | 147 | 710 | -563 |
| Digger | Warner Bros. | 124 | 203 | -79 |
| Crawlers | Roadside Attractions | 91 | 117 | -26 |
| Tad and the Magic Lamp | Paramount Pictures | 62 | | New |
| Angel and the Badman | Angel Studios | 54 | 104 | -50 |
| Buddy | Roadside Attractions | 5 | 13 | -8 |
| Queen at Sea | Greenwich Entertainment | 1 | | New |
Theater counts for November 6
The Numbers Business Report: Q3 2027 Box Office Prediction
October 5, 2026

The last two Business Reports featured our first analysis of 2027, with predictions for all announced wide releases in the first and second quarters. In this month’s Report, we continue building out predictions for 2027, shifting our focus towards the second half of the year.
The table below highlights our model’s current prediction for the top 10 films of Q3 2027, shown alongside the top 10 grossers from the same period in 2026 and 2025. Subscribe to receive our full predictions.
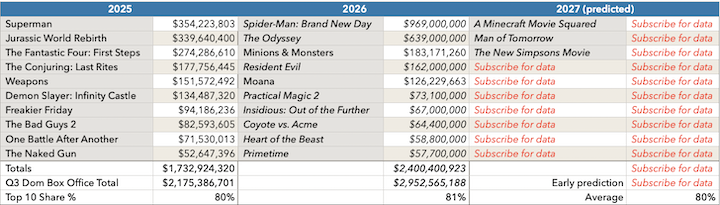
July’s releases once again dominate Q3, led by a trio of franchise titles. Predicted to claim the top spot is A Minecraft Movie Squared, the sequel to A Minecraft Movie, which earned $424.1m domestically. Next is DC Studios’ Man of Tomorrow, the follow-up to Superman, which topped Q3 2025 with $354.2m. Rounding out the month is A Quiet Place Part III, the latest in a franchise that has earned $487.3m to date.
August and September are led by family titles and horror. The Bluey Movie brings the hit series to theaters while TMNT 2 continues the story of Teenage Mutant Ninja Turtles: Mutant Mayhem. In September, The New Simpsons Movie arrives two decades after The Simpsons Movie and The Conjuring: First Communion follows the franchise-best $177.8m for Last Rites.
We’ll be updating our tracking as the months go on, and our full prediction for 2027 releases in November. Subscribe to The Numbers Business Report to receive monthly updates.

Also in this edition...
We have our final pre-release predictions for all of October’s wide releases, including Street Fighter and Clayface (among many others), along with our full 2026, Q1-Q3 2027 predictions.
Our domestic and international release schedules cover all films releasing domestically over the next month, and all major international releases in 15 territories, organized by date and by movie.
For the home market, we have a monthly update on the theatrical window for new releases, including trend analysis. We’ve also added information on what films are available or coming soon to streaming services.
On the talent front, we include Bankability values for the top 500 creative talents in the business, expanding our unique perspective on the people in front of, and behind the camera.
To take our prediction analysis further, alongside The Business Report, we are publishing a six-week market theatrical forecast every week. That has day-by-day predictions for all movies in the top 10 and the expected market size over the next 42 days. Subscribers also receive print and digital editions of the Report, and optional forecast spreadsheets and Bankability reports. Contact The Numbers Business Report team to subscribe to the weekly edition. Click here to subscribe to The Numbers Business Report monthly edition.
Contact The Numbers Business Report team.
Ticket prices up 5% in Q2 vs. 2025 as attendance climbs 10%
September 10, 2026

The first half of 2026 has brought a lot of optimism about the future of the theatrical industry, with the second quarter delivering phenomenal results. For some theater chains, total revenue during the second quarter reached historical records. Fueled by the success of movies such as The Super Mario Galaxy Movie, Michael, Toy Story 5, Obsession, The Devil Wears Prada 2, and Backrooms, admissions revenue increased by around 13% on average among the theater chains tracked in this analysis compared with the same period last year. This growth was primarily driven by a 10% average increase in attendance compared with Q2 2025.
Based on these results, our model estimates an average ticket price of $12.27 for the second quarter, approximately 5% higher than in 2025. The relatively modest increase in average ticket price compared with the growth in admissions revenue suggests that the majority of the revenue growth was driven by increased attendance rather than pricing strategies alone.

Additionally, the average concession spend (among the three theater chains reporting concession revenue) was approximately $8 per patron during the quarter, 3% higher than in Q2 2025.
Our model relies on average ticket price data reported in SEC filings from three major theater chains: AMC, Cinemark, and Cineplex. This data is modeled against historical averages previously reported by the Cinema United organization (through 2021) and The Cinema Foundation’s 2022 Theatrical Market Report. Beginning in 2025, we updated our model using additional data from our partners, resulting in revised estimates starting from 2022, as shown in the table below.

To get quarterly updates to average ticket prices, box office predictions for the next 12 months, and more, subscribe to The Numbers Business Report.
Contact The Numbers Business Report team.
The Numbers Named Official Data Partner of the Independent Film & Television Alliance
September 2, 2026

We’re excited to announce our new strategic partnership with the Independent Film & Television Alliance (IFTA), organizer of the American Film Market (AFM), naming The Numbers as the organization’s official data partner.
The collaboration will give IFTA members preferred access to our Comp Analysis Reports and research services, along with educational webinars on financing, market positioning, and distribution strategy, plus data and research support for AFM programming throughout the year.
Bruce Nash, founder of The Numbers and president of Nash Information Services, said the partnership would help IFTA members “make more informed decisions in a complex and growing marketplace”.
IFTA president and CEO Jackie Brenneman said, “Our collaboration with The Numbers will give our members and the broader independent community greater insight into what is happening across the marketplace, help them put that information to work as they finance, produce, sell and distribute content around the world, and better understand the trends shaping where the business is headed.”
Read the full announcement from Screen Daily here.
The Numbers Business Report: Q2 2027 Box Office Prediction
August 31, 2026

Last month, we started our analysis of 2027 with predictions for all announced wide releases in the first quarter. In this month’s Business Report, we continue building out our early predictions for 2027, shifting our attention to the second quarter of next year. Our feature article provides our first prediction for the second quarter, with detailed movie-by-movie forecasts for the major releases coming out.
The table below highlights our model’s current prediction for the top 10 films of Q2 2027, shown alongside the top 10 grossers from the same period in 2026 and 2025. Subscribe to receive our full predictions.
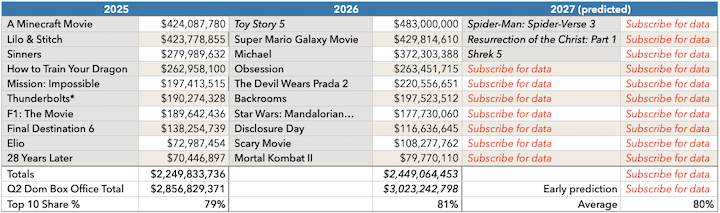
Turning to movies released in Q2 2027, by month, our current standouts are:
April: The Legend of Zelda ($280m)
May: The Resurrection of Christ: Part One ($310m)
June: Spider-Man: Beyond the Spiderverse ($330m) and Shrek 5 ($300m)
To discover our full official prediction for the first quarter, subscribe to The Numbers Business Report.
Similar to previous years, Q2 2027 should feature several titles earning over $100 million, primarily from established and successful franchises. Examples include Spider-Man: Beyond the Spider-Verse, part of Sony’s animated Spider-Verse franchise ($571.8 million domestic across its first two films), and Shrek 5, continuing a series that has grossed $1.61 billion domestically since 2001. Other major releases include Star Wars: Starfighter, extending a franchise that has grossed $5.31 billion domestically since 1977; The Resurrection of the Christ: Part One, following 2004’s $370.8 million domestic hit The Passion of the Christ; and The Legend of Zelda, the video game franchise’s first theatrical adaptation.
We’ll be updating our tracking as the months go on, and our full prediction for 2027 releases in November. Subscribe to The Numbers Business Report to receive monthly updates.

Also in this edition...
We have our final pre-release predictions for all of September’s wide releases, including Practical Magic 2 and The End of Oak Street (among many others), along with our full 2026 and Q1 2027, and Q2 2027 predictions.
Our domestic and international release schedules cover all films releasing domestically over the next month, and all major international releases in 15 territories, organized by date and by movie.
For the home market, we have a monthly update on the theatrical window for new releases, including trend analysis. We’ve also added information on what films are available or coming soon to streaming services.
On the talent front, we include Bankability values for the top 500 creative talents in the business, expanding our unique perspective on the people in front of, and behind the camera.
To take our prediction analysis further, alongside The Business Report, we are publishing a six-week market theatrical forecast every week. That has day-by-day predictions for all movies in the top 10 and the expected market size over the next 42 days. Subscribers also receive print and digital editions of the Report, and optional forecast spreadsheets and Bankability reports. Contact The Numbers Business Report team to subscribe to the weekly edition. Click here to subscribe to The Numbers Business Report monthly edition.
Contact The Numbers Business Report team.
The Numbers Business Report: Q1 2027 Box Office Prediction
August 13, 2026

With the first half of 2026 officially wrapped, we turn our thoughts to 2027 in this month’s Business Report. Our feature article provides our first prediction for the first quarter, with detailed movie-by-movie forecasts for the major releases coming out.
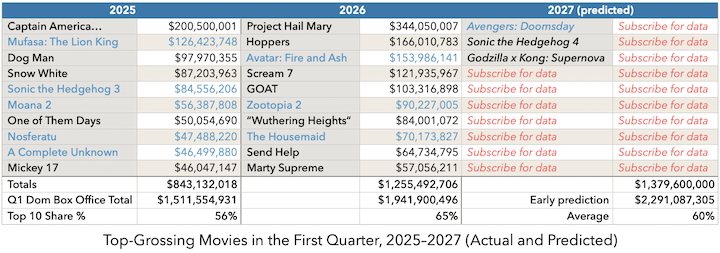
Major franchise continuations and sequels dominate the first quarter this year, much more than last, although the late 2026 film, Avengers: Doomsday, is predicted to earn $660m in total, and $217.8m of that falls into 2027. March’s top earner, Sonic the Hedgehog 4, follows closely behind with a $210m predicted gross. We also see the latest(/final?) installments of major franchises like Dune and Jumanji from December of this year contribute to the top earners of Q1 2027.
Turning to movies released in Q1 2027, by month, our current standouts are:
January: The Beekeeper 2 ($59m)
February: Ice Age: Boiling Point ($142m)
March: Sonic the Hedgehog 4 ($210m)
We’ll be updating our tracking as the months go on, and our full prediction for 2027 releases in November. To discover our full official prediction for the first quarter, subscribe to The Numbers Business Report.

Also in this edition...
We have our final pre-release predictions for all of August’s wide releases, including The End of Oak Street and The Dog Stars (among many others), along with our full 2026 and Q1 2027 predictions.
Our domestic and international release schedules cover all films being released domestically over the next month, and all major international releases in 15 territories, organized by date and by movie.
For the home market, we have a monthly update on the theatrical window for new releases, including trend analysis. We’ve also added information on what films are available or coming soon to streaming services.
On the talent front, we include Bankability values for the top 500 creative talents in the business, expanding our unique perspective on the people in front of, and behind, the camera.
To take our prediction analysis further, alongside The Business Report, we are publishing a six-week market theatrical forecast every week. That has day-by-day predictions for all movies in the top 10 and the expected market size over the next 42 days. Subscribers also receive print and digital editions of the Report, and optional forecast spreadsheets and Bankability reports. Contact The Numbers Business Report team to subscribe to the weekly edition. Click here to subscribe to The Numbers Business Report monthly edition.
Contact The Numbers Business Report team.
Movie pages now have full international details, plus cast & crew
July 22, 2026

Our site build-out continues this week with two major new features on the movie pages. The International tab (which sharp-eyed readers will have noticed appear a few days ago) shows the details of all international territories for which we have reported box office for each movie. This includes our complete archive of movies, with extensive historical information.
Also new this week is the cast and crew details for movies. Again, we have extensive historical information, along with details for recent releases. The cast & crew tab highlights above-the-line and leading credits in each movie.
Look for more new features soon as we build out the site, and if you’re interested in background information on what’s been happening at The Numbers over the past few months, check out Stephen Follows’ article, published today.
Bruce Nash, bruce.nash@the-numbers.com.
The Numbers Business Report: Live AI search tracking, a mid-year update
July 9, 2026

We introduced our Live AI Search tracking in the March issue of The Numbers Business Report, and have been working on refining our collection and analysis of the numbers since then. This month, we show some early results in using these new statistics to predict opening weekend box office for upcoming movies.
Large language models such as ChatGPT, Claude, and Perplexity generally consist of two components: a crawler and a live search agent. Starting last year, we began tracking and gathering all requests coming from AI agents. We can then link these data points to our OpusData database, allowing us to monitor what AI agents are requesting and translate that into a signal of audience interest.
The charts below show the first results of our modeling. They show the correlation between ChatGPT live searches in the 28 days leading up to the release of a movie and the movie’s opening weekend.

To read our full analysis, subscribe to The Business Report.

Also in this edition...
We have our final pre-release predictions for all of July’s wide releases, including The Odyssey and Spider-Man: Brand New Day (among many others), along with our full 2026 predictions.
Our domestic and international release schedules cover all films being released domestically over the next month, and all major international releases in 15 territories, organized by date and by movie.
For the home market, we have a monthly update on the theatrical window for new releases, including trend analysis. We’ve also added information on what films are available or coming soon to streaming services.
On the talent front, we include Bankability values for the top 250 creative talents in the business, expanding our unique perspective on the people in front of, and behind the camera.
To take our prediction analysis further, alongside The Business Report, we are publishing a six-week market theatrical forecast every week. That has day-by-day predictions for all movies in the top 10 and the expected market size over the next 42 days. Subscribers also receive print and digital editions of the Report, and optional forecast spreadsheets and Bankability reports. Contact The Numbers Business Report team to subscribe to the weekly edition. Click here to subscribe to The Numbers Business Report monthly edition.
Contact The Numbers Business Report team.
Weekend box office: Toy Story tops weekend with franchise-best $160 million
June 22, 2026

Toy Story 5 dominated the market at the weekend, posting a spectacular $159.7 million, according to Disney. That’s the best weekend ever for the franchise, topping Toy Story 4’s $120.9 million debut back in 2019. It also overtakes The Super Mario Galaxy Movie to have the best weekend of 2026 so far.
Here are the official studio numbers for the weekend (click the image for a full chart of all films reporting).

Toy Story 5 opened to exceptionally strong audience reception, with Rotten Tomatoes reporting a 95% “Verified Hot” audience score from more than 2,500 verified moviegoers, alongside a 93% Certified Fresh critics’ rating. Early audience polling from ComScore’s PostTrak showed top-tier satisfaction, including 5 out of 5 stars from parents and 4.5 out of 5 stars from both general audiences and children. Overall, 91% of viewers rated the film positively, with 63% describing it as “excellent.” CinemaScore reinforced the film’s strong debut, awarding it an “A,” continuing Pixar’s consistent streak of A-range grades across its releases.
Premium viewing formats played a significant role in the film’s opening weekend performance, accounting for 40% of total box office revenue. Standard 2D screenings made up the majority at 60%, while premium large format (PLF) 2D contributed 19% and IMAX 2D added 8%. In total, 2D formats represented 89% of ticket sales, compared to 11% for 3D formats. Audience demographics reflected broad appeal, with a gender split of 57% female and 43% male. The film attracted a diverse audience, including 37% Caucasian, 32% Hispanic, 13% African American, 9% Asian, and 9% Native American or other groups. Age distribution skewed toward families and younger adults, led by viewers under 12 (25%), followed by ages 25–34 (22%) and 35–44 (20%).
Internationally, Toy Story 5 delivered strong opening results across key markets, led by Mexico with $26.6 million, followed by the United Kingdom at $20.0 million and China at $18.0 million. In Europe, France contributed $7.2 million, Spain $5.5 million, and Italy $3.5 million, while Australia added $6.9 million. Latin America proved particularly robust, with Brazil and Korea each generating $6.1 million, Argentina $5.4 million, Colombia $4.2 million, and Central America $3.7 million, underscoring the film’s broad global appeal.
Bruce Nash, bruce.nash@the-numbers.com.
The Numbers Business Report asks, where have all the indie films gone?
June 11, 2026

Movies from the major studios may get most of the buzz, but by the raw numbers, most movies that get made and distributed have more humble origins. In the latest The Numbers Business Report, we look at the universe of movies produced and distributed for sale, either in theaters, on a digital transactional platform, or a subscription streaming service in the domestic market (the United States and Canada) between 2021 and 2025. In this study, we call these “commercial releases,” in contrast to “ad-supported content,” which includes content produced for platforms like YouTube, and also movies released solely on AVOD services.
What we’ve found is a tale of two markets. On the one hand, the theatrical market has shown growth over the past five years, with 101 domestically-produced and released narrative features earning over $1 million at the box office in 2021, and 160 such movies in 2025. With new distribution technologies making it easier than ever to get movies into theaters, the total number of domestically-produced narrative features getting any sort of theatrical release has also increased, from 494 in 2021 to 598 in 2025.
The increase in that number contrasts with a steep decline among direct-to-digital titles. Movies bypassing theaters, but still having a commercial release, fell from 1,427 in 2022 to 721 last year. That’s a decline of nearly 50% in just three years.

Subscribe to The Business Report for details on how we compiled the data, and what we think is happening to cause this remarkable shift in the independent film business in such a short time.

Also in this edition...
We have our final pre-release predictions for all of June’s wide releases, including Disclosure Day and Toy Story 5 (among many others), along with our full 2026 predictions.
Our domestic and international release schedules cover all films being released domestically over the next month, and all major international releases in 15 territories, organized by date and by movie.
For the home market, we have a monthly update on the theatrical window for new releases, including trend analysis. We’ve also added information on what films are available or coming soon to streaming services.
On the talent front, we include Bankability values for the top 250 creative talents in the business, expanding our unique perspective on the people in front of, and behind the camera.
To take our prediction analysis further, alongside The Business Report, we are publishing a six-week market theatrical forecast every week. That has day-by-day predictions for all movies in the top 10 and the expected market size over the next 42 days. Subscribers also receive print and digital editions of the Report, and optional forecast spreadsheets and Bankability reports. Click here to subscribe.
Contact The Numbers Business Report team.
The new The Numbers
March 11, 2026

We’re excited to announce a major update to The Numbers. We’re rebuilding the site to take advantage of new technologies and introduce a suite of new features. Look for many more updates in the days and weeks to come, but we wanted to get the site up and running on our new servers as quickly as possible so you can still get our first-in-the-industry box office reporting while we work.
We imagine you have some questions…
Where have you been?
This is a major upgrade to all our systems, from our back-end OpusData database, through The Numbers server infrastructure to the web-site front end. As is common with a major project like this, we’ve hit some issues along the way that have slowed progress. We’re working round the clock to get everything up and running… watch this space!
Where are the historical charts, movie pages, franchise information, records pages…?
We’ll be bringing back pages from the old version of the site ASAP, prioritizing the most popular pages first.
Are you going to put everything behind a paywall?
No! The Numbers has always been completely free to use, and we intend to keep it that way.
Can’t you just bring back the old site?
Unfortunately, the old site is incompatible with our new infrastructure. After careful consideration, we decided to focus our resources on improving the new site, rather than dividing our time between making the old site compatible with the new infrastructure and building the new site. That will pay off in the end, and we apologize that things will be ”under construction“ for a while.
We’ll post regular updates on progress here on the home page, and on social media. Feel free to message us there if you have questions, or email us at support@the-numbers.com.
We look forward to sharing new features with you soon!


