56 Up (2013)
| Theatrical Performance | ||
| Domestic Box Office | $701,278 | Details |
| OpusData ID: 182720100 More info... | ||
| Further financial details... | ||
Synopsis
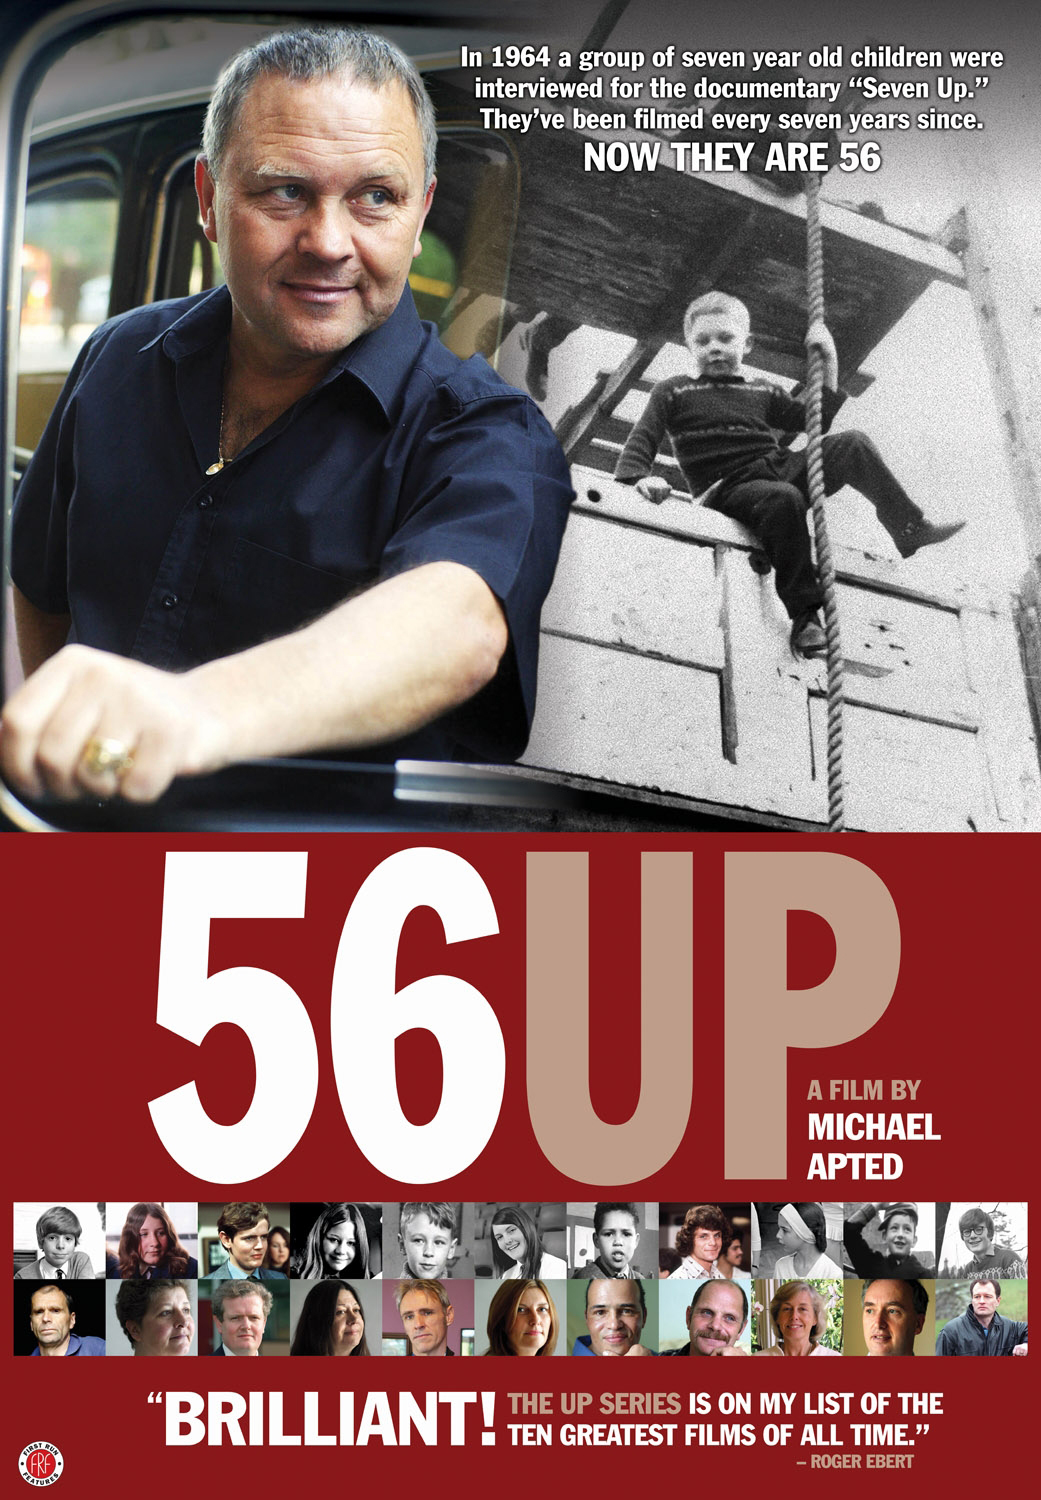
Starting in 1964 with Seven Up, The UP Series has explored this Jesuit maxim. The original concept was to interview 14 children from diverse backgrounds from all over England, asking them about their lives and their dreams for the future. Every seven years, renowned director Michael Apted, a researcher for Seven Up, has been back to talk to them, examining the progression of their lives. Now they are 56. An extraordinary look at the structure of life in the 20th century, The UP Series is, according to critic Roger Ebert, "an inspired, almost noble use of the film medium. Apted penetrates to the central mystery of life."
Metrics
| Opening Weekend: | $22,088 (3.1% of total gross) |
| Legs: | 10.03 (domestic box office/biggest weekend) |
| Domestic Share: | 100.0% (domestic box office/worldwide) |
| Theater counts: | 1 opening theaters/35 max. theaters, 7.0 weeks average run per theater |
| Infl. Adj. Dom. BO | $1,063,020 |
Movie Details
| Domestic Releases: | January 4th, 2013 (Limited) by First Run Features |
| Video Release: | July 2nd, 2013 by First Run Home |
| MPA Rating: | Not Rated |
| Running Time: | 144 minutes |
| Franchise: | 7 Up |
| Plot point: | Cancer, Death of a Sibling, Mental Illness, Musicians |
| Release detail: | TV Premiere |
| Social setting: | Foster Family, Upstairs / Downstairs |
| Source: | Based on Real Life Events |
| Genre: | Documentary |
| Production Method: | Live Action |
| Creative Type: | Factual |
| Production/Financing Companies: | ITV Studios Limited |
| Production Countries: | United States |
| Languages: | English |
Weekend Box Office Performance
| Date | Rank | Gross | % Change | Theaters | Per Theater | Total Gross | Week |
|---|---|---|---|---|---|---|---|
| Jan 4, 2013 | 49 | $22,088 | 1 | $22,088 | $22,088 | 1 | |
| Jan 11, 2013 | 53 | $17,659 | -20% | 2 | $8,830 | $52,075 | 2 |
| Jan 18, 2013 | 46 | $32,035 | +81% | 4 | $8,009 | $91,501 | 3 |
| Jan 25, 2013 | 49 | $37,352 | +17% | 11 | $3,396 | $146,629 | 4 |
| Feb 1, 2013 | 53 | $26,343 | -29% | 13 | $2,026 | $229,977 | 5 |
| Feb 8, 2013 | 51 | $37,750 | +43% | 16 | $2,359 | $280,855 | 6 |
| Feb 15, 2013 | 43 | $69,933 | +85% | 27 | $2,590 | $371,062 | 7 |
| Feb 22, 2013 | 42 | $55,669 | -20% | 32 | $1,740 | $464,617 | 8 |
| Mar 1, 2013 | 55 | $37,720 | -32% | 27 | $1,397 | $523,526 | 9 |
| Mar 8, 2013 | 55 | $26,770 | -29% | 25 | $1,071 | $569,547 | 10 |
| Mar 15, 2013 | 64 | $14,239 | -47% | 20 | $712 | $604,043 | 11 |
| Mar 22, 2013 | 71 | $11,519 | -19% | 16 | $720 | $624,016 | 12 |
| Mar 29, 2013 | 68 | $15,607 | +35% | 15 | $1,040 | $649,677 | 13 |
| Apr 5, 2013 | 75 | $7,326 | -53% | 10 | $733 | $668,506 | 14 |
| Apr 12, 2013 | 90 | $1,989 | -73% | 4 | $497 | $673,142 | 15 |
| Apr 19, 2013 | 78 | $5,453 | +174% | 5 | $1,091 | $679,659 | 16 |
| Apr 26, 2013 | 82 | $4,810 | -12% | 6 | $802 | $686,326 | 17 |
| May 3, 2013 | 94 | $2,539 | -47% | 2 | $1,270 | $691,066 | 18 |
| May 10, 2013 | 96 | $1,739 | -32% | 3 | $580 | $693,930 | 19 |
| May 17, 2013 | 99 | $475 | -73% | 1 | $475 | $695,371 | 20 |
| May 24, 2013 | 96 | $200 | -58% | 1 | $200 | $695,571 | 21 |
| May 31, 2013 | 83 | $234 | +17% | 1 | $234 | $695,911 | 22 |
| Jun 14, 2013 | 96 | $485 | 2 | $243 | $696,396 | 24 | |
| Jul 5, 2013 | 46 | $2,363 | 1 | $2,363 | $698,759 | 27 |
Weekly Box Office Performance
| Date | Rank | Gross | % Change | Theaters | Per Theater | Total Gross | Week |
|---|---|---|---|---|---|---|---|
| Jan 4, 2013 | 51 | $34,416 | 1 | $34,416 | $34,416 | 1 | |
| Jan 11, 2013 | 50 | $24,884 | -28% | 2 | $12,442 | $59,466 | 2 |
| Jan 18, 2013 | 46 | $49,793 | +100% | 6 | $8,299 | $109,259 | 3 |
| Jan 25, 2013 | 49 | $54,649 | +10% | 11 | $4,968 | $203,634 | 4 |
| Feb 1, 2013 | 52 | $39,471 | -28% | 13 | $3,036 | $243,105 | 5 |
| Feb 8, 2013 | 55 | $57,730 | +46% | 19 | $3,038 | $300,835 | 6 |
| Feb 15, 2013 | 40 | $106,590 | +85% | 28 | $3,807 | $408,948 | 7 |
| Feb 22, 2013 | 44 | $76,858 | -28% | 35 | $2,196 | $485,806 | 8 |
| Mar 1, 2013 | 55 | $56,971 | -26% | 32 | $1,780 | $542,777 | 9 |
| Mar 8, 2013 | 53 | $43,813 | -23% | 33 | $1,328 | $589,804 | 10 |
| Mar 15, 2013 | 65 | $22,693 | -48% | 22 | $1,032 | $612,497 | 11 |
| Mar 22, 2013 | 72 | $20,477 | -10% | 21 | $975 | $634,070 | 12 |
| Mar 29, 2013 | 65 | $24,915 | +22% | 18 | $1,384 | $661,180 | 13 |
| Apr 5, 2013 | 77 | $10,742 | -57% | 12 | $895 | $671,967 | 14 |
| Apr 12, 2013 | 93 | $3,053 | -72% | 4 | $763 | $674,206 | 15 |
| Apr 19, 2013 | 81 | $7,310 | +139% | 5 | $1,462 | $681,516 | 16 |
| Apr 26, 2013 | 81 | $6,912 | -5% | 9 | $768 | $688,428 | 17 |
| May 3, 2013 | 98 | $3,664 | -47% | 3 | $1,221 | $692,191 | 18 |
| May 10, 2013 | 99 | $2,705 | -26% | 3 | $902 | $694,896 | 19 |
| May 17, 2013 | 104 | $475 | -82% | 1 | $475 | $695,371 | 20 |
| May 24, 2013 | 100 | $306 | -36% | 1 | $306 | $695,677 | 21 |
| May 31, 2013 | 93 | $234 | -24% | 1 | $234 | $695,911 | 22 |
| Jun 14, 2013 | 98 | $789 | 2 | $395 | $696,700 | 24 | |
| Jul 5, 2013 | 41 | $2,667 | 1 | $2,667 | $699,063 | 27 | |
| Jul 12, 2013 | 73 | $2,215 | -17% | 1 | $2,215 | $701,278 | 28 |
Full financial estimates for this film, including domestic and international box office, video sales, video rentals, TV and ancillary revenue are available through our research services. For more information, please contact us at research@the-numbers.com.
Synopsis
Starting in 1964 with Seven Up, The UP Series has explored this Jesuit maxim. The original concept was to interview 14 children from diverse backgrounds from all over England, asking them about their lives and their dreams for the future. Every seven years, renowned director Michael Apted, a researcher for Seven Up, has been back to talk to them, examining the progression of their lives. Now they are 56. An extraordinary look at the structure of life in the 20th century, The UP Series is, according to critic Roger Ebert, "an inspired, almost noble use of the film medium. Apted penetrates to the central mystery of life."
Metrics
| Opening Weekend: | $22,088 (3.1% of total gross) |
| Legs: | 10.03 (domestic box office/biggest weekend) |
| Domestic Share: | 100.0% (domestic box office/worldwide) |
| Theater counts: | 1 opening theaters/35 max. theaters, 7.0 weeks average run per theater |
| Infl. Adj. Dom. BO | $1,063,020 |
Movie Details
| Domestic Releases: | January 4th, 2013 (Limited) by First Run Features |
| Video Release: | July 2nd, 2013 by First Run Home |
| MPA Rating: | Not Rated |
| Running Time: | 144 minutes |
| Franchise: | 7 Up |
| Plot point: | Cancer, Death of a Sibling, Mental Illness, Musicians |
| Release detail: | TV Premiere |
| Social setting: | Foster Family, Upstairs / Downstairs |
| Source: | Based on Real Life Events |
| Genre: | Documentary |
| Production Method: | Live Action |
| Creative Type: | Factual |
| Production/Financing Companies: | ITV Studios Limited |
| Production Countries: | United States |
| Languages: | English |
Weekend Box Office Performance
| Date | Rank | Gross | % Change | Theaters | Per Theater | Total Gross | Week |
|---|---|---|---|---|---|---|---|
| Jan 4, 2013 | 49 | $22,088 | 1 | $22,088 | $22,088 | 1 | |
| Jan 11, 2013 | 53 | $17,659 | -20% | 2 | $8,830 | $52,075 | 2 |
| Jan 18, 2013 | 46 | $32,035 | +81% | 4 | $8,009 | $91,501 | 3 |
| Jan 25, 2013 | 49 | $37,352 | +17% | 11 | $3,396 | $146,629 | 4 |
| Feb 1, 2013 | 53 | $26,343 | -29% | 13 | $2,026 | $229,977 | 5 |
| Feb 8, 2013 | 51 | $37,750 | +43% | 16 | $2,359 | $280,855 | 6 |
| Feb 15, 2013 | 43 | $69,933 | +85% | 27 | $2,590 | $371,062 | 7 |
| Feb 22, 2013 | 42 | $55,669 | -20% | 32 | $1,740 | $464,617 | 8 |
| Mar 1, 2013 | 55 | $37,720 | -32% | 27 | $1,397 | $523,526 | 9 |
| Mar 8, 2013 | 55 | $26,770 | -29% | 25 | $1,071 | $569,547 | 10 |
| Mar 15, 2013 | 64 | $14,239 | -47% | 20 | $712 | $604,043 | 11 |
| Mar 22, 2013 | 71 | $11,519 | -19% | 16 | $720 | $624,016 | 12 |
| Mar 29, 2013 | 68 | $15,607 | +35% | 15 | $1,040 | $649,677 | 13 |
| Apr 5, 2013 | 75 | $7,326 | -53% | 10 | $733 | $668,506 | 14 |
| Apr 12, 2013 | 90 | $1,989 | -73% | 4 | $497 | $673,142 | 15 |
| Apr 19, 2013 | 78 | $5,453 | +174% | 5 | $1,091 | $679,659 | 16 |
| Apr 26, 2013 | 82 | $4,810 | -12% | 6 | $802 | $686,326 | 17 |
| May 3, 2013 | 94 | $2,539 | -47% | 2 | $1,270 | $691,066 | 18 |
| May 10, 2013 | 96 | $1,739 | -32% | 3 | $580 | $693,930 | 19 |
| May 17, 2013 | 99 | $475 | -73% | 1 | $475 | $695,371 | 20 |
| May 24, 2013 | 96 | $200 | -58% | 1 | $200 | $695,571 | 21 |
| May 31, 2013 | 83 | $234 | +17% | 1 | $234 | $695,911 | 22 |
| Jun 14, 2013 | 96 | $485 | 2 | $243 | $696,396 | 24 | |
| Jul 5, 2013 | 46 | $2,363 | 1 | $2,363 | $698,759 | 27 |
Weekly Box Office Performance
| Date | Rank | Gross | % Change | Theaters | Per Theater | Total Gross | Week |
|---|---|---|---|---|---|---|---|
| Jan 4, 2013 | 51 | $34,416 | 1 | $34,416 | $34,416 | 1 | |
| Jan 11, 2013 | 50 | $24,884 | -28% | 2 | $12,442 | $59,466 | 2 |
| Jan 18, 2013 | 46 | $49,793 | +100% | 6 | $8,299 | $109,259 | 3 |
| Jan 25, 2013 | 49 | $54,649 | +10% | 11 | $4,968 | $203,634 | 4 |
| Feb 1, 2013 | 52 | $39,471 | -28% | 13 | $3,036 | $243,105 | 5 |
| Feb 8, 2013 | 55 | $57,730 | +46% | 19 | $3,038 | $300,835 | 6 |
| Feb 15, 2013 | 40 | $106,590 | +85% | 28 | $3,807 | $408,948 | 7 |
| Feb 22, 2013 | 44 | $76,858 | -28% | 35 | $2,196 | $485,806 | 8 |
| Mar 1, 2013 | 55 | $56,971 | -26% | 32 | $1,780 | $542,777 | 9 |
| Mar 8, 2013 | 53 | $43,813 | -23% | 33 | $1,328 | $589,804 | 10 |
| Mar 15, 2013 | 65 | $22,693 | -48% | 22 | $1,032 | $612,497 | 11 |
| Mar 22, 2013 | 72 | $20,477 | -10% | 21 | $975 | $634,070 | 12 |
| Mar 29, 2013 | 65 | $24,915 | +22% | 18 | $1,384 | $661,180 | 13 |
| Apr 5, 2013 | 77 | $10,742 | -57% | 12 | $895 | $671,967 | 14 |
| Apr 12, 2013 | 93 | $3,053 | -72% | 4 | $763 | $674,206 | 15 |
| Apr 19, 2013 | 81 | $7,310 | +139% | 5 | $1,462 | $681,516 | 16 |
| Apr 26, 2013 | 81 | $6,912 | -5% | 9 | $768 | $688,428 | 17 |
| May 3, 2013 | 98 | $3,664 | -47% | 3 | $1,221 | $692,191 | 18 |
| May 10, 2013 | 99 | $2,705 | -26% | 3 | $902 | $694,896 | 19 |
| May 17, 2013 | 104 | $475 | -82% | 1 | $475 | $695,371 | 20 |
| May 24, 2013 | 100 | $306 | -36% | 1 | $306 | $695,677 | 21 |
| May 31, 2013 | 93 | $234 | -24% | 1 | $234 | $695,911 | 22 |
| Jun 14, 2013 | 98 | $789 | 2 | $395 | $696,700 | 24 | |
| Jul 5, 2013 | 41 | $2,667 | 1 | $2,667 | $699,063 | 27 | |
| Jul 12, 2013 | 73 | $2,215 | -17% | 1 | $2,215 | $701,278 | 28 |
Full financial estimates for this film, including domestic and international box office, video sales, video rentals, TV and ancillary revenue are available through our research services. For more information, please contact us at research@the-numbers.com.