McFarland, USA (2015)
| Theatrical Performance | ||
| Domestic Box Office | $44,480,275 | Details |
| International Box Office | $1,227,649 | Details |
| Worldwide Box Office | $45,707,924 | |
| Domestic Physical Disc Sales | ||
| DVD Sales (estimated) | $8,378,465 | |
| Blu-ray Sales (estimated) | $1,064,812 | |
| Total | $9,443,277 | |
| OpusData ID: 197730100 More info... | ||
| Further financial details... | ||
Synopsis
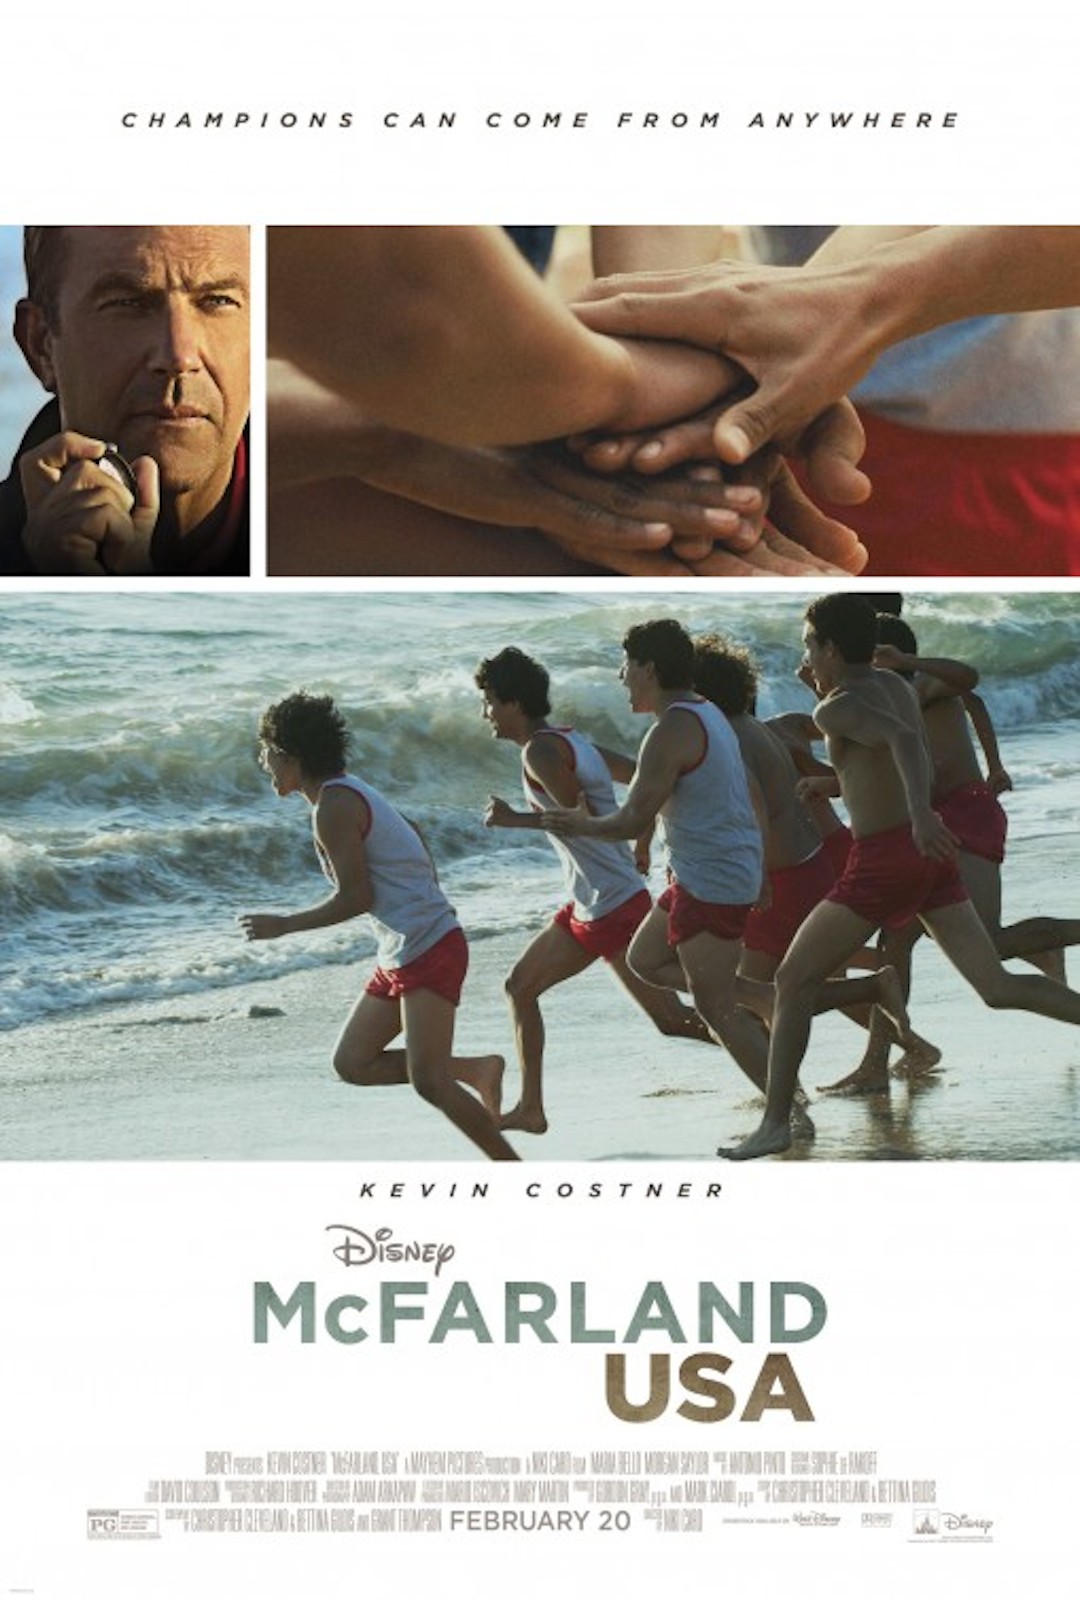
The true against-all-odds story of the 1987 McFarland high school cross country team in an economically challenged community.
Metrics
| Opening Weekend: | $11,020,798 (24.8% of total gross) |
| Legs: | 4.04 (domestic box office/biggest weekend) |
| Domestic Share: | 97.3% (domestic box office/worldwide) |
| Production Budget: | $17,000,000 (worldwide box office is 2.7 times production budget) |
| Theater counts: | 2,755 opening theaters/2,792 max. theaters, 5.9 weeks average run per theater |
| Infl. Adj. Dom. BO | $63,106,055 |
Movie Details
| Domestic Releases: | February 20th, 2015 (Wide) by Walt Disney |
| International Releases: | February 27th, 2015 (Wide) (Mexico)
March 6th, 2015 (Wide) (Ecuador) March 12th, 2015 (Wide), released as McFarland (Australia) June 26th, 2015 (Wide) (Turkey) September 25th, 2015 (Wide), released as McFarland (United Kingdom) ... Show all releases |
| Video Release: | June 2nd, 2015 by Buena Vista Home Entertainment |
| MPA Rating: | PG for thematic material, some violence and language. (Rating bulletin 2322, 5/14/2014) |
| Running Time: | 128 minutes |
| Geographical setting: | California |
| Plot point: | Football, Inspirational Coach, Inspirational Sports, Miscellaneous Racing, Miscellaneous Sports, Poverty, Track and Field |
| Social setting: | Life on a Farm |
| Subgenre: | Sports Drama |
| Target audience: | Hispanic |
| Time period setting: | 1980s |
| Source: | Based on Real Life Events |
| Genre: | Drama |
| Production Method: | Live Action |
| Creative Type: | Dramatization |
| Production/Financing Companies: | Mayhem Pictures |
| Production Countries: | United States |
| Languages: | English |
Weekend Box Office Performance
| Date | Rank | Gross | % Change | Theaters | Per Theater | Total Gross | Week |
|---|---|---|---|---|---|---|---|
| Feb 20, 2015 | 4 | $11,020,798 | 2,755 | $4,000 | $11,020,798 | 1 | |
| Feb 27, 2015 | 6 | $7,835,205 | -29% | 2,765 | $2,834 | $22,019,186 | 2 |
| Mar 6, 2015 | 7 | $5,222,630 | -33% | 2,792 | $1,871 | $29,331,061 | 3 |
| Mar 13, 2015 | 8 | $3,604,989 | -31% | 2,455 | $1,468 | $34,887,096 | 4 |
| Mar 20, 2015 | 11 | $2,197,381 | -39% | 1,816 | $1,210 | $38,531,357 | 5 |
| Mar 27, 2015 | 12 | $1,122,021 | -49% | 1,126 | $996 | $40,563,717 | 6 |
| Apr 3, 2015 | 13 | $618,631 | -45% | 703 | $880 | $41,774,129 | 7 |
| Apr 10, 2015 | 15 | $421,414 | -32% | 518 | $814 | $42,605,917 | 8 |
| Apr 17, 2015 | 22 | $204,835 | -51% | 271 | $756 | $42,955,377 | 9 |
| Apr 24, 2015 | 27 | $141,814 | -31% | 182 | $779 | $43,183,712 | 10 |
| May 1, 2015 | 28 | $84,432 | -40% | 140 | $603 | $43,312,431 | 11 |
| May 8, 2015 | 27 | $156,136 | +85% | 128 | $1,220 | $43,504,555 | 12 |
| May 15, 2015 | 23 | $216,953 | +39% | 198 | $1,096 | $43,777,355 | 13 |
| May 22, 2015 | 23 | $174,498 | -20% | 171 | $1,020 | $44,018,874 | 14 |
| May 29, 2015 | 25 | $102,683 | -41% | 150 | $685 | $44,222,976 | 15 |
| Jun 5, 2015 | 32 | $56,408 | -45% | 103 | $548 | $44,333,249 | 16 |
| Jun 12, 2015 | 39 | $36,597 | -35% | 73 | $501 | $44,407,545 | 17 |
| Jun 19, 2015 | 52 | $15,766 | -57% | 39 | $404 | $44,447,725 | 18 |
| Jun 26, 2015 | 56 | $11,753 | -25% | 24 | $490 | $44,469,602 | 19 |
| Jul 3, 2015 | 66 | $4,194 | -64% | 12 | $350 | $44,480,275 | 20 |
Daily Box Office Performance
| Date | Rank | Gross | %YD | %LW | Theaters | Per Theater | Total Gross | Days |
|---|---|---|---|---|---|---|---|---|
| Feb 20, 2015 | 5 | $3,633,069 | 2,755 | $1,319 | $3,633,069 | 1 | ||
| Feb 21, 2015 | 5 | $4,550,899 | +25% | 2,755 | $1,652 | $8,183,968 | 2 | |
| Feb 22, 2015 | 4 | $2,836,830 | -38% | 2,755 | $1,030 | $11,020,798 | 3 | |
| Feb 23, 2015 | 4 | $719,437 | -75% | 2,755 | $261 | $11,740,235 | 4 | |
| Feb 24, 2015 | 3 | $1,044,309 | +45% | 2,755 | $379 | $12,784,544 | 5 | |
| Feb 25, 2015 | 4 | $659,319 | -37% | 2,755 | $239 | $13,443,863 | 6 | |
| Feb 26, 2015 | 4 | $740,118 | +12% | 2,755 | $269 | $14,183,981 | 7 | |
| Feb 27, 2015 | 7 | $1,992,903 | +169% | -45% | 2,765 | $721 | $16,176,884 | 8 |
| Feb 28, 2015 | 6 | $3,629,615 | +82% | -20% | 2,765 | $1,313 | $19,806,499 | 9 |
| Mar 1, 2015 | 5 | $2,212,687 | -39% | -22% | 2,765 | $800 | $22,019,186 | 10 |
| Mar 2, 2015 | 6 | $509,424 | -77% | -29% | 2,765 | $184 | $22,528,610 | 11 |
| Mar 3, 2015 | 6 | $604,325 | +19% | -42% | 2,765 | $219 | $23,132,935 | 12 |
| Mar 4, 2015 | 5 | $433,908 | -28% | -34% | 2,765 | $157 | $23,566,843 | 13 |
| Mar 5, 2015 | 4 | $541,588 | +25% | -27% | 2,765 | $196 | $24,108,431 | 14 |
| Mar 6, 2015 | 9 | $1,459,126 | +169% | -27% | 2,792 | $523 | $25,567,557 | 15 |
| Mar 7, 2015 | 8 | $2,364,005 | +62% | -35% | 2,792 | $847 | $27,931,562 | 16 |
| Mar 8, 2015 | 6 | $1,399,499 | -41% | -37% | 2,792 | $501 | $29,331,061 | 17 |
| Mar 9, 2015 | 7 | $454,334 | -68% | -11% | 2,792 | $163 | $29,785,395 | 18 |
| Mar 10, 2015 | 6 | $582,840 | +28% | -4% | 2,792 | $209 | $30,368,235 | 19 |
| Mar 11, 2015 | 6 | $460,534 | -21% | +6% | 2,792 | $165 | $30,828,769 | 20 |
| Mar 12, 2015 | 6 | $453,338 | -2% | -16% | 2,792 | $162 | $31,282,107 | 21 |
| Mar 13, 2015 | 7 | $1,053,046 | +132% | -28% | 2,455 | $429 | $32,335,153 | 22 |
| Mar 14, 2015 | 8 | $1,639,577 | +56% | -31% | 2,455 | $668 | $33,974,730 | 23 |
| Mar 15, 2015 | 8 | $912,366 | -44% | -35% | 2,455 | $372 | $34,887,096 | 24 |
| Mar 16, 2015 | 8 | $307,167 | -66% | -32% | 2,455 | $125 | $35,194,263 | 25 |
| Mar 17, 2015 | 8 | $404,187 | +32% | -31% | 2,455 | $165 | $35,598,450 | 26 |
| Mar 18, 2015 | 8 | $382,490 | -5% | -17% | 2,455 | $156 | $35,980,940 | 27 |
| Mar 19, 2015 | 8 | $353,036 | -8% | -22% | 2,455 | $144 | $36,333,976 | 28 |
| Mar 20, 2015 | 10 | $628,700 | +78% | -40% | 1,816 | $346 | $36,962,676 | 29 |
| Mar 21, 2015 | 11 | $999,503 | +59% | -39% | 1,816 | $550 | $37,962,179 | 30 |
| Mar 22, 2015 | 11 | $569,178 | -43% | -38% | 1,816 | $313 | $38,531,357 | 31 |
| Mar 23, 2015 | 10 | $230,762 | -59% | -25% | 1,816 | $127 | $38,762,119 | 32 |
| Mar 24, 2015 | 10 | $267,580 | +16% | -34% | 1,816 | $147 | $39,029,699 | 33 |
| Mar 25, 2015 | 10 | $217,288 | -19% | -43% | 1,816 | $120 | $39,246,987 | 34 |
| Mar 26, 2015 | 10 | $194,709 | -10% | -45% | 1,816 | $107 | $39,441,696 | 35 |
| Mar 27, 2015 | 12 | $342,440 | +76% | -46% | 1,126 | $304 | $39,784,136 | 36 |
| Mar 28, 2015 | 12 | $488,501 | +43% | -51% | 1,126 | $434 | $40,272,637 | 37 |
| Mar 29, 2015 | 12 | $291,080 | -40% | -49% | 1,126 | $259 | $40,563,717 | 38 |
| Mar 30, 2015 | 11 | $131,709 | -55% | -43% | 1,126 | $117 | $40,695,426 | 39 |
| Mar 31, 2015 | 11 | $166,197 | +26% | -38% | 1,126 | $148 | $40,861,623 | 40 |
| Apr 1, 2015 | 11 | $148,059 | -11% | -32% | 1,126 | $131 | $41,009,682 | 41 |
| Apr 2, 2015 | 11 | $145,816 | -2% | -25% | 1,126 | $129 | $41,155,498 | 42 |
| Apr 3, 2015 | 11 | $234,521 | +61% | -32% | 703 | $334 | $41,390,019 | 43 |
| Apr 4, 2015 | 13 | $207,239 | -12% | -58% | 703 | $295 | $41,597,258 | 44 |
| Apr 5, 2015 | 11 | $176,871 | -15% | -39% | 703 | $252 | $41,774,129 | 45 |
| Apr 6, 2015 | 11 | $98,365 | -44% | -25% | 703 | $140 | $41,872,494 | 46 |
| Apr 7, 2015 | 11 | $127,145 | +29% | -23% | 703 | $181 | $41,999,639 | 47 |
| Apr 8, 2015 | 11 | $99,249 | -22% | -33% | 703 | $141 | $42,098,888 | 48 |
| Apr 9, 2015 | 11 | $85,615 | -14% | -41% | 703 | $122 | $42,184,503 | 49 |
| Apr 10, 2015 | 15 | $139,886 | +63% | -40% | 518 | $270 | $42,324,389 | 50 |
| Apr 11, 2015 | 14 | $184,709 | +32% | -11% | 518 | $357 | $42,509,098 | 51 |
| Apr 12, 2015 | 14 | $96,819 | -48% | -45% | 518 | $187 | $42,605,917 | 52 |
| Apr 13, 2015 | 14 | $32,040 | -67% | -67% | 518 | $62 | $42,637,957 | 53 |
| Apr 14, 2015 | 14 | $42,990 | +34% | -66% | 518 | $83 | $42,680,947 | 54 |
| Apr 15, 2015 | 14 | $34,698 | -19% | -65% | 518 | $67 | $42,715,645 | 55 |
| Apr 16, 2015 | 14 | $34,897 | +1% | -59% | 518 | $67 | $42,750,542 | 56 |
Weekly Box Office Performance
| Date | Rank | Gross | % Change | Theaters | Per Theater | Total Gross | Week |
|---|---|---|---|---|---|---|---|
| Feb 20, 2015 | 4 | $14,183,981 | 2,755 | $5,148 | $14,183,981 | 1 | |
| Feb 27, 2015 | 6 | $9,924,450 | -30% | 2,765 | $3,589 | $24,108,431 | 2 |
| Mar 6, 2015 | 7 | $7,173,676 | -28% | 2,792 | $2,569 | $31,282,107 | 3 |
| Mar 13, 2015 | 8 | $5,051,869 | -30% | 2,455 | $2,058 | $36,333,976 | 4 |
| Mar 20, 2015 | 11 | $3,107,720 | -38% | 1,816 | $1,711 | $39,441,696 | 5 |
| Mar 27, 2015 | 12 | $1,713,802 | -45% | 1,126 | $1,522 | $41,155,498 | 6 |
| Apr 3, 2015 | 11 | $1,029,005 | -40% | 703 | $1,464 | $42,184,503 | 7 |
| Apr 10, 2015 | 15 | $566,039 | -45% | 518 | $1,093 | $42,750,542 | 8 |
| Apr 17, 2015 | 22 | $291,356 | -49% | 271 | $1,075 | $43,041,898 | 9 |
| Apr 24, 2015 | 28 | $186,101 | -36% | 182 | $1,023 | $43,227,999 | 10 |
| May 1, 2015 | 27 | $120,420 | -35% | 140 | $860 | $43,348,419 | 11 |
| May 8, 2015 | 26 | $211,983 | +76% | 128 | $1,656 | $43,560,402 | 12 |
| May 15, 2015 | 21 | $283,974 | +34% | 128 | $2,219 | $43,844,376 | 13 |
| May 22, 2015 | 23 | $275,917 | -3% | 171 | $1,614 | $44,120,293 | 14 |
| May 29, 2015 | 26 | $156,548 | -43% | 150 | $1,044 | $44,276,841 | 15 |
| Jun 5, 2015 | 31 | $94,107 | -40% | 103 | $914 | $44,370,948 | 16 |
| Jun 12, 2015 | 38 | $61,011 | -35% | 103 | $592 | $44,431,959 | 17 |
| Jun 19, 2015 | 48 | $25,890 | -58% | 39 | $664 | $44,457,849 | 18 |
| Jun 26, 2015 | 61 | $18,232 | -30% | 24 | $760 | $44,476,081 | 19 |
Top International Territories
Box Office Summary Per Territory
| Territory | Release Date |
Opening Weekend |
Opening Weekend Screens/Theaters |
Maximum Screens/Theaters |
Theatrical Engagements |
Total Box Office |
Report Date |
|||
|---|---|---|---|---|---|---|---|---|---|---|
| Ecuador | 3/6/2015 | $0 | 0 | 2 | 2 | $110,792 | 12/30/2018 | |||
| Mexico | 2/27/2015 | $84,853 | 0 | 0 | 0 | $424,265 | 8/30/2018 | |||
| Turkey | 6/26/2015 | $3,829 | 18 | 18 | 29 | $10,697 | 12/30/2018 | |||
| United Kingdom | 9/25/2015 | $19,379 | 115 | 115 | 117 | $31,658 | 12/1/2015 | |||
| Rest of World | $650,237 | |||||||||
| International Total | $1,227,649 | 12/30/2018 | ||||||||
Note: Territories vary in whether they report screens or theaters. Full details on international box office data are available via our OpusData service.
Lead Ensemble Member
| Kevin Costner | Jim White |
Supporting
| Maria Bello | Cheryl White | |
| Morgan Saylor | Julie White | |
| Martha Higareda | Lupe |
Lead Ensemble Member
| Michael Aguero | Damacio Diaz | |
| Sergio Avelar | Victor Puentes | |
| Hector Duran | Johnny Sameiego | |
| Rafael Martinez | David Diaz | |
| Johnny Ortiz | Jose Cardenas | |
| Carlos Pratts | Thomas Valles | |
| Ramiro Rodriguez | Danny Diaz |
Supporting
| Danny Mora | Sammy | |
| Valente Rodriguez | Principal Camillo | |
| Vanessa Martinez | Maria Marsol | |
| Diana-Maria Riva | Senora Diaz | |
| Elsie Fisher | Jamie White | |
| Ben Bray | Ernesto Valles | |
| Rigo Sanchez | Javi | |
| Chris Ellis | Coach Jenks | |
| Eloy Casados | Dale Padilla | |
| Josh Clark | Coach Jameson | |
| Chelsea Rendon | Sonia Rosaldo | |
| Daniel Moncada | Eddie | |
| Chad Moncada | Clovis Coach | |
| J. Downing | State Race Official | |
| Brian Connors | Park Aide | |
| Vincent Martella | Brandon | |
| Juana Flores | Senora Soto | |
| Regi Davis | Centennial Coach | |
| Connor Weil | Palo Alto Runner #1 | |
| Brian Hayes Currie | Stevens Creek Coach | |
| Sarah Benoit | Principal Camillo's Assistant | |
| Salvador Perez | Player #1 | |
| Rebecca Silva | Grandmother Valles | |
| John Funk | Centennial Assistant Coach | |
| Jeffrey Sheller | Palo Alto Assistant Coach | |
| Alfredo Lopez | Mariachi Singer |
Production and Technical Credits
| Niki Caro | Director | |
| Christopher Cleveland | Screenwriter | |
| Bettina Gilois | Screenwriter | |
| Grant Thompson | Screenwriter | |
| Christopher Cleveland | Story Creator | |
| Bettina Gilois | Story Creator | |
| Gordon Gray | Producer | |
| Mark Ciardi | Producer | |
| Mario Iscovich | Executive Producer | |
| Mary Martin | Executive Producer | |
| Adam Arkapaw | Director of Photography | |
| Richard Hoover | Production Designer | |
| David Coulson | Editor | |
| Sophie de Rakoff | Costume Designer | |
| Antonio Pinto | Composer | |
| Victor Constantino | Co-Producer | |
| Margaret Hilliard | Unit Production Manager | |
| Karen Steward | Supervising Art Director | |
| Alice Baker | Set Decorator | |
| Cameron Birnie | Set Designer | |
| Ronald Judkins | Sound Mixer | |
| Gwendolyn Yates Whittle | Supervising Sound Editor | |
| Kyrsten Mate | Sound Designer | |
| Dean A. Zupancic | Re-recording Mixer | |
| Anna Behlmer | Re-recording Mixer | |
| J.D. Schwalm | Special Effects Supervisor | |
| Gintar Repecka | Special Effects Coordinator | |
| Patrick McClung | Visual Effects Supervisor | |
| Liz Tan | Assistant Director | |
| Stephanie Tull | Assistant Director | |
| Ryan D. Craig | Assistant Director | |
| Leslie Rodier | Post-Production Supervisor | |
| Susan Malerstein-Watkins | Script Supervisor | |
| Dyanna Taylor | Director of Photography | |
| Robin Whittaker | Music Editor | |
| John Kurlander | Score Recordist | |
| John Kurlander | Score Mixer | |
| Sophie Carbonell | Costume Designer | |
| David Swope | Costume Supervisor | |
| Francisco X. Perez | Make up | |
| RaMona Fleetwood | Hairstylist | |
| Robert Shoup | Sound Effects Editor | |
| Teresa Eckton | Sound Effects Editor | |
| Jeremy Paul Bowker | Sound Effects Editor | |
| Pete Horner | Sound Effects Editor | |
| Daniel Laurie | Dialogue/ADR Editor | |
| Cheryl Nardi | Dialogue Editor | |
| Corey Tyler | Foley Mixer | |
| Terry Porter | Re-recording Mixer | |
| Sheila Jaffe | Casting Director | |
| Yolanda Guillen | Casting Director | |
| J.C. Cantu | Casting Director | |
| Steve M. Davison* | Stunt Coordinator | |
| Robert F. Brown* | Stunt Coordinator | |
| Mark R. Ellis* | Stunt Coordinator |
Cast and crew with above-the-line roles are marked in bold. The line marks the division between above-the-line and below-the-line roles.
Full financial estimates for this film, including domestic and international box office, video sales, video rentals, TV and ancillary revenue are available through our research services. For more information, please contact us at research@the-numbers.com.
Synopsis
The true against-all-odds story of the 1987 McFarland high school cross country team in an economically challenged community.
Metrics
| Opening Weekend: | $11,020,798 (24.8% of total gross) |
| Legs: | 4.04 (domestic box office/biggest weekend) |
| Domestic Share: | 97.3% (domestic box office/worldwide) |
| Production Budget: | $17,000,000 (worldwide box office is 2.7 times production budget) |
| Theater counts: | 2,755 opening theaters/2,792 max. theaters, 5.9 weeks average run per theater |
| Infl. Adj. Dom. BO | $63,106,055 |
Movie Details
| Domestic Releases: | February 20th, 2015 (Wide) by Walt Disney |
| International Releases: | February 27th, 2015 (Wide) (Mexico)
March 6th, 2015 (Wide) (Ecuador) March 12th, 2015 (Wide), released as McFarland (Australia) June 26th, 2015 (Wide) (Turkey) September 25th, 2015 (Wide), released as McFarland (United Kingdom) ... Show all releases |
| Video Release: | June 2nd, 2015 by Buena Vista Home Entertainment |
| MPA Rating: | PG for thematic material, some violence and language. (Rating bulletin 2322, 5/14/2014) |
| Running Time: | 128 minutes |
| Geographical setting: | California |
| Plot point: | Football, Inspirational Coach, Inspirational Sports, Miscellaneous Racing, Miscellaneous Sports, Poverty, Track and Field |
| Social setting: | Life on a Farm |
| Subgenre: | Sports Drama |
| Target audience: | Hispanic |
| Time period setting: | 1980s |
| Source: | Based on Real Life Events |
| Genre: | Drama |
| Production Method: | Live Action |
| Creative Type: | Dramatization |
| Production/Financing Companies: | Mayhem Pictures |
| Production Countries: | United States |
| Languages: | English |
Weekend Box Office Performance
| Date | Rank | Gross | % Change | Theaters | Per Theater | Total Gross | Week |
|---|---|---|---|---|---|---|---|
| Feb 20, 2015 | 4 | $11,020,798 | 2,755 | $4,000 | $11,020,798 | 1 | |
| Feb 27, 2015 | 6 | $7,835,205 | -29% | 2,765 | $2,834 | $22,019,186 | 2 |
| Mar 6, 2015 | 7 | $5,222,630 | -33% | 2,792 | $1,871 | $29,331,061 | 3 |
| Mar 13, 2015 | 8 | $3,604,989 | -31% | 2,455 | $1,468 | $34,887,096 | 4 |
| Mar 20, 2015 | 11 | $2,197,381 | -39% | 1,816 | $1,210 | $38,531,357 | 5 |
| Mar 27, 2015 | 12 | $1,122,021 | -49% | 1,126 | $996 | $40,563,717 | 6 |
| Apr 3, 2015 | 13 | $618,631 | -45% | 703 | $880 | $41,774,129 | 7 |
| Apr 10, 2015 | 15 | $421,414 | -32% | 518 | $814 | $42,605,917 | 8 |
| Apr 17, 2015 | 22 | $204,835 | -51% | 271 | $756 | $42,955,377 | 9 |
| Apr 24, 2015 | 27 | $141,814 | -31% | 182 | $779 | $43,183,712 | 10 |
| May 1, 2015 | 28 | $84,432 | -40% | 140 | $603 | $43,312,431 | 11 |
| May 8, 2015 | 27 | $156,136 | +85% | 128 | $1,220 | $43,504,555 | 12 |
| May 15, 2015 | 23 | $216,953 | +39% | 198 | $1,096 | $43,777,355 | 13 |
| May 22, 2015 | 23 | $174,498 | -20% | 171 | $1,020 | $44,018,874 | 14 |
| May 29, 2015 | 25 | $102,683 | -41% | 150 | $685 | $44,222,976 | 15 |
| Jun 5, 2015 | 32 | $56,408 | -45% | 103 | $548 | $44,333,249 | 16 |
| Jun 12, 2015 | 39 | $36,597 | -35% | 73 | $501 | $44,407,545 | 17 |
| Jun 19, 2015 | 52 | $15,766 | -57% | 39 | $404 | $44,447,725 | 18 |
| Jun 26, 2015 | 56 | $11,753 | -25% | 24 | $490 | $44,469,602 | 19 |
| Jul 3, 2015 | 66 | $4,194 | -64% | 12 | $350 | $44,480,275 | 20 |
Daily Box Office Performance
| Date | Rank | Gross | %YD | %LW | Theaters | Per Theater | Total Gross | Days |
|---|---|---|---|---|---|---|---|---|
| Feb 20, 2015 | 5 | $3,633,069 | 2,755 | $1,319 | $3,633,069 | 1 | ||
| Feb 21, 2015 | 5 | $4,550,899 | +25% | 2,755 | $1,652 | $8,183,968 | 2 | |
| Feb 22, 2015 | 4 | $2,836,830 | -38% | 2,755 | $1,030 | $11,020,798 | 3 | |
| Feb 23, 2015 | 4 | $719,437 | -75% | 2,755 | $261 | $11,740,235 | 4 | |
| Feb 24, 2015 | 3 | $1,044,309 | +45% | 2,755 | $379 | $12,784,544 | 5 | |
| Feb 25, 2015 | 4 | $659,319 | -37% | 2,755 | $239 | $13,443,863 | 6 | |
| Feb 26, 2015 | 4 | $740,118 | +12% | 2,755 | $269 | $14,183,981 | 7 | |
| Feb 27, 2015 | 7 | $1,992,903 | +169% | -45% | 2,765 | $721 | $16,176,884 | 8 |
| Feb 28, 2015 | 6 | $3,629,615 | +82% | -20% | 2,765 | $1,313 | $19,806,499 | 9 |
| Mar 1, 2015 | 5 | $2,212,687 | -39% | -22% | 2,765 | $800 | $22,019,186 | 10 |
| Mar 2, 2015 | 6 | $509,424 | -77% | -29% | 2,765 | $184 | $22,528,610 | 11 |
| Mar 3, 2015 | 6 | $604,325 | +19% | -42% | 2,765 | $219 | $23,132,935 | 12 |
| Mar 4, 2015 | 5 | $433,908 | -28% | -34% | 2,765 | $157 | $23,566,843 | 13 |
| Mar 5, 2015 | 4 | $541,588 | +25% | -27% | 2,765 | $196 | $24,108,431 | 14 |
| Mar 6, 2015 | 9 | $1,459,126 | +169% | -27% | 2,792 | $523 | $25,567,557 | 15 |
| Mar 7, 2015 | 8 | $2,364,005 | +62% | -35% | 2,792 | $847 | $27,931,562 | 16 |
| Mar 8, 2015 | 6 | $1,399,499 | -41% | -37% | 2,792 | $501 | $29,331,061 | 17 |
| Mar 9, 2015 | 7 | $454,334 | -68% | -11% | 2,792 | $163 | $29,785,395 | 18 |
| Mar 10, 2015 | 6 | $582,840 | +28% | -4% | 2,792 | $209 | $30,368,235 | 19 |
| Mar 11, 2015 | 6 | $460,534 | -21% | +6% | 2,792 | $165 | $30,828,769 | 20 |
| Mar 12, 2015 | 6 | $453,338 | -2% | -16% | 2,792 | $162 | $31,282,107 | 21 |
| Mar 13, 2015 | 7 | $1,053,046 | +132% | -28% | 2,455 | $429 | $32,335,153 | 22 |
| Mar 14, 2015 | 8 | $1,639,577 | +56% | -31% | 2,455 | $668 | $33,974,730 | 23 |
| Mar 15, 2015 | 8 | $912,366 | -44% | -35% | 2,455 | $372 | $34,887,096 | 24 |
| Mar 16, 2015 | 8 | $307,167 | -66% | -32% | 2,455 | $125 | $35,194,263 | 25 |
| Mar 17, 2015 | 8 | $404,187 | +32% | -31% | 2,455 | $165 | $35,598,450 | 26 |
| Mar 18, 2015 | 8 | $382,490 | -5% | -17% | 2,455 | $156 | $35,980,940 | 27 |
| Mar 19, 2015 | 8 | $353,036 | -8% | -22% | 2,455 | $144 | $36,333,976 | 28 |
| Mar 20, 2015 | 10 | $628,700 | +78% | -40% | 1,816 | $346 | $36,962,676 | 29 |
| Mar 21, 2015 | 11 | $999,503 | +59% | -39% | 1,816 | $550 | $37,962,179 | 30 |
| Mar 22, 2015 | 11 | $569,178 | -43% | -38% | 1,816 | $313 | $38,531,357 | 31 |
| Mar 23, 2015 | 10 | $230,762 | -59% | -25% | 1,816 | $127 | $38,762,119 | 32 |
| Mar 24, 2015 | 10 | $267,580 | +16% | -34% | 1,816 | $147 | $39,029,699 | 33 |
| Mar 25, 2015 | 10 | $217,288 | -19% | -43% | 1,816 | $120 | $39,246,987 | 34 |
| Mar 26, 2015 | 10 | $194,709 | -10% | -45% | 1,816 | $107 | $39,441,696 | 35 |
| Mar 27, 2015 | 12 | $342,440 | +76% | -46% | 1,126 | $304 | $39,784,136 | 36 |
| Mar 28, 2015 | 12 | $488,501 | +43% | -51% | 1,126 | $434 | $40,272,637 | 37 |
| Mar 29, 2015 | 12 | $291,080 | -40% | -49% | 1,126 | $259 | $40,563,717 | 38 |
| Mar 30, 2015 | 11 | $131,709 | -55% | -43% | 1,126 | $117 | $40,695,426 | 39 |
| Mar 31, 2015 | 11 | $166,197 | +26% | -38% | 1,126 | $148 | $40,861,623 | 40 |
| Apr 1, 2015 | 11 | $148,059 | -11% | -32% | 1,126 | $131 | $41,009,682 | 41 |
| Apr 2, 2015 | 11 | $145,816 | -2% | -25% | 1,126 | $129 | $41,155,498 | 42 |
| Apr 3, 2015 | 11 | $234,521 | +61% | -32% | 703 | $334 | $41,390,019 | 43 |
| Apr 4, 2015 | 13 | $207,239 | -12% | -58% | 703 | $295 | $41,597,258 | 44 |
| Apr 5, 2015 | 11 | $176,871 | -15% | -39% | 703 | $252 | $41,774,129 | 45 |
| Apr 6, 2015 | 11 | $98,365 | -44% | -25% | 703 | $140 | $41,872,494 | 46 |
| Apr 7, 2015 | 11 | $127,145 | +29% | -23% | 703 | $181 | $41,999,639 | 47 |
| Apr 8, 2015 | 11 | $99,249 | -22% | -33% | 703 | $141 | $42,098,888 | 48 |
| Apr 9, 2015 | 11 | $85,615 | -14% | -41% | 703 | $122 | $42,184,503 | 49 |
| Apr 10, 2015 | 15 | $139,886 | +63% | -40% | 518 | $270 | $42,324,389 | 50 |
| Apr 11, 2015 | 14 | $184,709 | +32% | -11% | 518 | $357 | $42,509,098 | 51 |
| Apr 12, 2015 | 14 | $96,819 | -48% | -45% | 518 | $187 | $42,605,917 | 52 |
| Apr 13, 2015 | 14 | $32,040 | -67% | -67% | 518 | $62 | $42,637,957 | 53 |
| Apr 14, 2015 | 14 | $42,990 | +34% | -66% | 518 | $83 | $42,680,947 | 54 |
| Apr 15, 2015 | 14 | $34,698 | -19% | -65% | 518 | $67 | $42,715,645 | 55 |
| Apr 16, 2015 | 14 | $34,897 | +1% | -59% | 518 | $67 | $42,750,542 | 56 |
Weekly Box Office Performance
| Date | Rank | Gross | % Change | Theaters | Per Theater | Total Gross | Week |
|---|---|---|---|---|---|---|---|
| Feb 20, 2015 | 4 | $14,183,981 | 2,755 | $5,148 | $14,183,981 | 1 | |
| Feb 27, 2015 | 6 | $9,924,450 | -30% | 2,765 | $3,589 | $24,108,431 | 2 |
| Mar 6, 2015 | 7 | $7,173,676 | -28% | 2,792 | $2,569 | $31,282,107 | 3 |
| Mar 13, 2015 | 8 | $5,051,869 | -30% | 2,455 | $2,058 | $36,333,976 | 4 |
| Mar 20, 2015 | 11 | $3,107,720 | -38% | 1,816 | $1,711 | $39,441,696 | 5 |
| Mar 27, 2015 | 12 | $1,713,802 | -45% | 1,126 | $1,522 | $41,155,498 | 6 |
| Apr 3, 2015 | 11 | $1,029,005 | -40% | 703 | $1,464 | $42,184,503 | 7 |
| Apr 10, 2015 | 15 | $566,039 | -45% | 518 | $1,093 | $42,750,542 | 8 |
| Apr 17, 2015 | 22 | $291,356 | -49% | 271 | $1,075 | $43,041,898 | 9 |
| Apr 24, 2015 | 28 | $186,101 | -36% | 182 | $1,023 | $43,227,999 | 10 |
| May 1, 2015 | 27 | $120,420 | -35% | 140 | $860 | $43,348,419 | 11 |
| May 8, 2015 | 26 | $211,983 | +76% | 128 | $1,656 | $43,560,402 | 12 |
| May 15, 2015 | 21 | $283,974 | +34% | 128 | $2,219 | $43,844,376 | 13 |
| May 22, 2015 | 23 | $275,917 | -3% | 171 | $1,614 | $44,120,293 | 14 |
| May 29, 2015 | 26 | $156,548 | -43% | 150 | $1,044 | $44,276,841 | 15 |
| Jun 5, 2015 | 31 | $94,107 | -40% | 103 | $914 | $44,370,948 | 16 |
| Jun 12, 2015 | 38 | $61,011 | -35% | 103 | $592 | $44,431,959 | 17 |
| Jun 19, 2015 | 48 | $25,890 | -58% | 39 | $664 | $44,457,849 | 18 |
| Jun 26, 2015 | 61 | $18,232 | -30% | 24 | $760 | $44,476,081 | 19 |
Top International Territories
Box Office Summary Per Territory
| Territory | Release Date |
Opening Weekend |
Opening Weekend Screens/Theaters |
Maximum Screens/Theaters |
Theatrical Engagements |
Total Box Office |
Report Date |
|||
|---|---|---|---|---|---|---|---|---|---|---|
| Ecuador | 3/6/2015 | $0 | 0 | 2 | 2 | $110,792 | 12/30/2018 | |||
| Mexico | 2/27/2015 | $84,853 | 0 | 0 | 0 | $424,265 | 8/30/2018 | |||
| Turkey | 6/26/2015 | $3,829 | 18 | 18 | 29 | $10,697 | 12/30/2018 | |||
| United Kingdom | 9/25/2015 | $19,379 | 115 | 115 | 117 | $31,658 | 12/1/2015 | |||
| Rest of World | $650,237 | |||||||||
| International Total | $1,227,649 | 12/30/2018 | ||||||||
Note: Territories vary in whether they report screens or theaters. Full details on international box office data are available via our OpusData service.
Lead Ensemble Member
| Kevin Costner | Jim White |
Supporting
| Maria Bello | Cheryl White | |
| Morgan Saylor | Julie White | |
| Martha Higareda | Lupe |
Lead Ensemble Member
| Michael Aguero | Damacio Diaz | |
| Sergio Avelar | Victor Puentes | |
| Hector Duran | Johnny Sameiego | |
| Rafael Martinez | David Diaz | |
| Johnny Ortiz | Jose Cardenas | |
| Carlos Pratts | Thomas Valles | |
| Ramiro Rodriguez | Danny Diaz |
Supporting
| Danny Mora | Sammy | |
| Valente Rodriguez | Principal Camillo | |
| Vanessa Martinez | Maria Marsol | |
| Diana-Maria Riva | Senora Diaz | |
| Elsie Fisher | Jamie White | |
| Ben Bray | Ernesto Valles | |
| Rigo Sanchez | Javi | |
| Chris Ellis | Coach Jenks | |
| Eloy Casados | Dale Padilla | |
| Josh Clark | Coach Jameson | |
| Chelsea Rendon | Sonia Rosaldo | |
| Daniel Moncada | Eddie | |
| Chad Moncada | Clovis Coach | |
| J. Downing | State Race Official | |
| Brian Connors | Park Aide | |
| Vincent Martella | Brandon | |
| Juana Flores | Senora Soto | |
| Regi Davis | Centennial Coach | |
| Connor Weil | Palo Alto Runner #1 | |
| Brian Hayes Currie | Stevens Creek Coach | |
| Sarah Benoit | Principal Camillo's Assistant | |
| Salvador Perez | Player #1 | |
| Rebecca Silva | Grandmother Valles | |
| John Funk | Centennial Assistant Coach | |
| Jeffrey Sheller | Palo Alto Assistant Coach | |
| Alfredo Lopez | Mariachi Singer |
Production and Technical Credits
| Niki Caro | Director | |
| Christopher Cleveland | Screenwriter | |
| Bettina Gilois | Screenwriter | |
| Grant Thompson | Screenwriter | |
| Christopher Cleveland | Story Creator | |
| Bettina Gilois | Story Creator | |
| Gordon Gray | Producer | |
| Mark Ciardi | Producer | |
| Mario Iscovich | Executive Producer | |
| Mary Martin | Executive Producer | |
| Adam Arkapaw | Director of Photography | |
| Richard Hoover | Production Designer | |
| David Coulson | Editor | |
| Sophie de Rakoff | Costume Designer | |
| Antonio Pinto | Composer | |
| Victor Constantino | Co-Producer | |
| Margaret Hilliard | Unit Production Manager | |
| Karen Steward | Supervising Art Director | |
| Alice Baker | Set Decorator | |
| Cameron Birnie | Set Designer | |
| Ronald Judkins | Sound Mixer | |
| Gwendolyn Yates Whittle | Supervising Sound Editor | |
| Kyrsten Mate | Sound Designer | |
| Dean A. Zupancic | Re-recording Mixer | |
| Anna Behlmer | Re-recording Mixer | |
| J.D. Schwalm | Special Effects Supervisor | |
| Gintar Repecka | Special Effects Coordinator | |
| Patrick McClung | Visual Effects Supervisor | |
| Liz Tan | Assistant Director | |
| Stephanie Tull | Assistant Director | |
| Ryan D. Craig | Assistant Director | |
| Leslie Rodier | Post-Production Supervisor | |
| Susan Malerstein-Watkins | Script Supervisor | |
| Dyanna Taylor | Director of Photography | |
| Robin Whittaker | Music Editor | |
| John Kurlander | Score Recordist | |
| John Kurlander | Score Mixer | |
| Sophie Carbonell | Costume Designer | |
| David Swope | Costume Supervisor | |
| Francisco X. Perez | Make up | |
| RaMona Fleetwood | Hairstylist | |
| Robert Shoup | Sound Effects Editor | |
| Teresa Eckton | Sound Effects Editor | |
| Jeremy Paul Bowker | Sound Effects Editor | |
| Pete Horner | Sound Effects Editor | |
| Daniel Laurie | Dialogue/ADR Editor | |
| Cheryl Nardi | Dialogue Editor | |
| Corey Tyler | Foley Mixer | |
| Terry Porter | Re-recording Mixer | |
| Sheila Jaffe | Casting Director | |
| Yolanda Guillen | Casting Director | |
| J.C. Cantu | Casting Director | |
| Steve M. Davison* | Stunt Coordinator | |
| Robert F. Brown* | Stunt Coordinator | |
| Mark R. Ellis* | Stunt Coordinator |
Cast and crew with above-the-line roles are marked in bold. The line marks the division between above-the-line and below-the-line roles.
Full financial estimates for this film, including domestic and international box office, video sales, video rentals, TV and ancillary revenue are available through our research services. For more information, please contact us at research@the-numbers.com.