The Whale (2011)
| Theatrical Performance | ||
| Domestic Box Office | $81,212 | Details |
| OpusData ID: 151950100 More info... | ||
| Further financial details... | ||
Synopsis
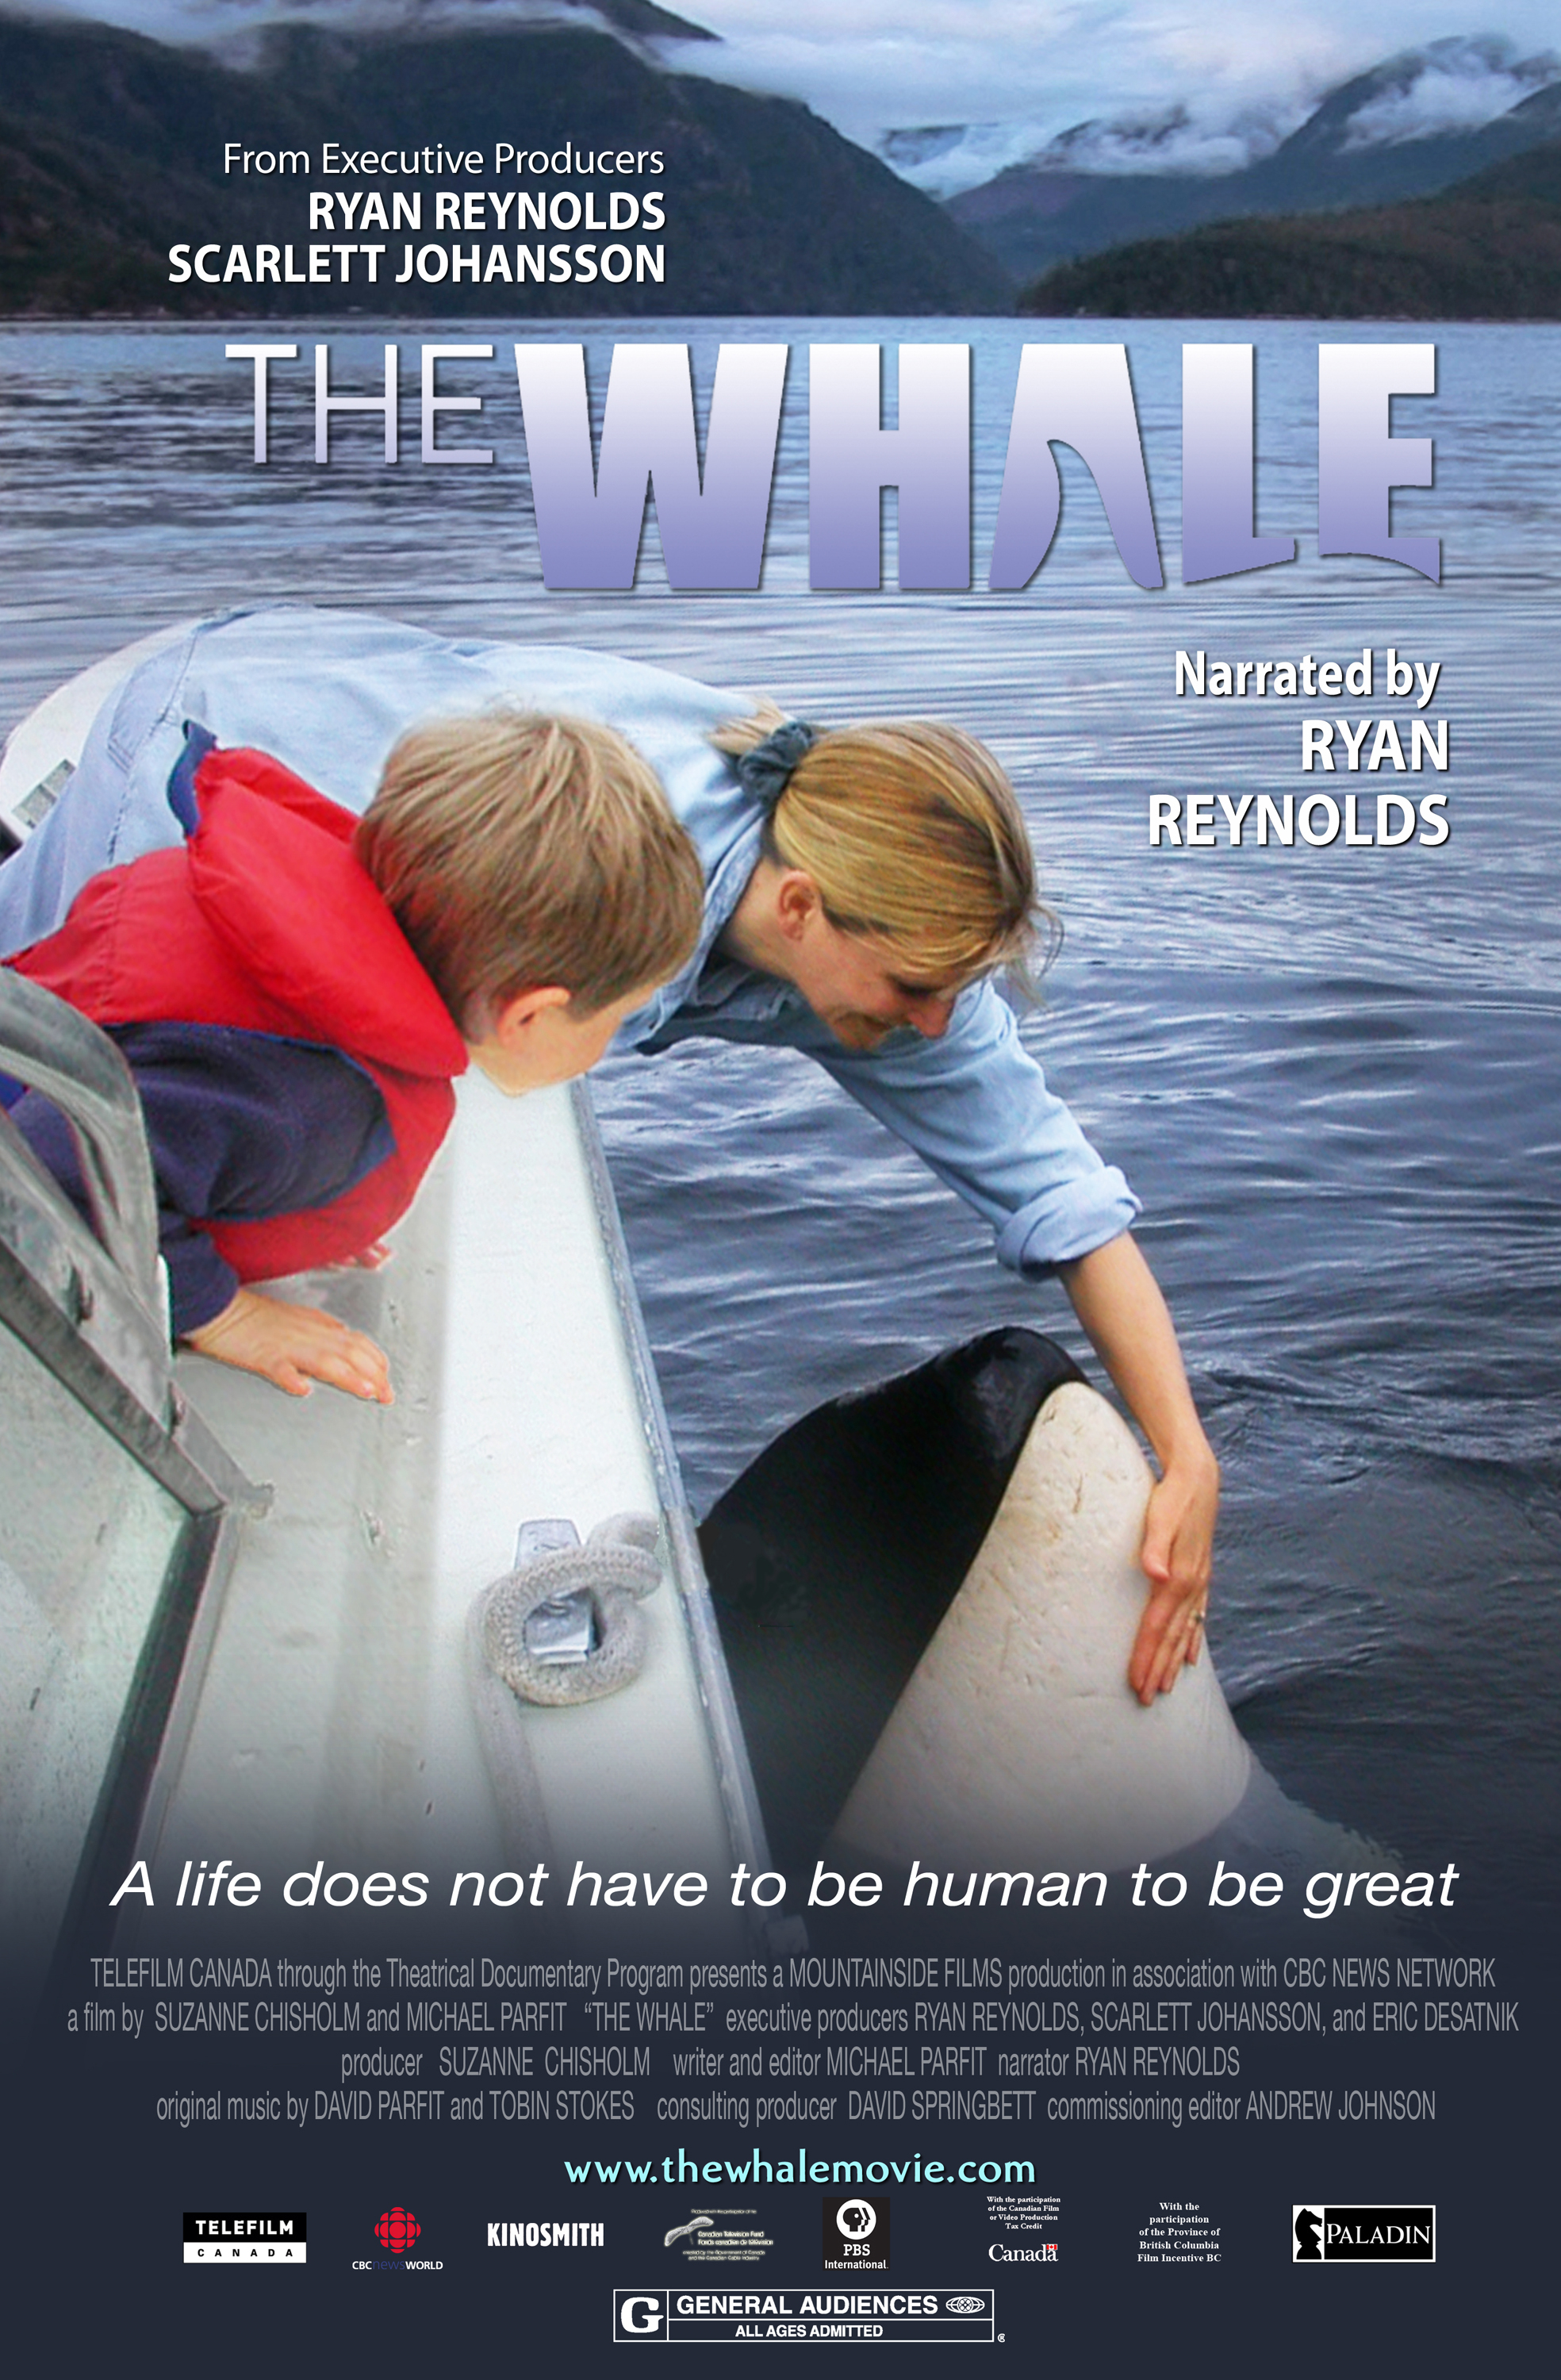
Set on the rugged western coast of Vancouver Island and narrated by Ryan Reynolds, this documentary describes what happens when Luna, a baby orca, gets separated from his family and unexpectedly starts making contact with people along a scenic fjord called Nootka Sound. Because orcas are highly social beings who spend their lives traveling with their pods, Luna attempts to find a surrogate family among the area residents, much to their delight. But as word spreads about Luna, people become torn between their love for the lonely young whale and fears that human contact might harm him. As Luna’s determination and charm change human lives all around him and make the unexpected the norm on Nootka Sound, the film becomes an unforgettable narrative about the mysteries, the dangers —and the promise—of friendship across forbidden boundaries.
Metrics
| Opening Weekend: | $4,835 (6.0% of total gross) |
| Legs: | 11.20 (domestic box office/biggest weekend) |
| Domestic Share: | 100.0% (domestic box office/worldwide) |
| Theater counts: | 2 opening theaters/5 max. theaters, 9.2 weeks average run per theater |
| Infl. Adj. Dom. BO | $122,363 |
Movie Details
| Domestic Releases: | September 9th, 2011 (Limited) by Paladin |
| Video Release: | December 4th, 2012 by Docurama Video |
| MPA Rating: | G (Rating bulletin 2147, 11/17/2010) |
| Running Time: | 85 minutes |
| Cast, crew, or production detail: | Animal Lead, Voiceover/Narration |
| Plot point: | Animal Rights |
| Source: | Based on Real Life Events |
| Genre: | Documentary |
| Production Method: | Live Action |
| Creative Type: | Factual |
| Production/Financing Companies: | Telefilm Canada, Theatrical Documentary Program, Mountianside Films |
| Production Countries: | Canada |
| Languages: | English |
Weekend Box Office Performance
| Date | Rank | Gross | % Change | Theaters | Per Theater | Total Gross | Week |
|---|---|---|---|---|---|---|---|
| Sep 9, 2011 | 96 | $4,835 | 2 | $2,418 | $4,835 | 1 | |
| Sep 16, 2011 | 115 | $1,394 | -71% | 2 | $697 | $8,481 | 2 |
| Sep 23, 2011 | 99 | $4,314 | +209% | 1 | $4,314 | $13,416 | 3 |
| Sep 30, 2011 | 91 | $4,556 | +6% | 2 | $2,278 | $18,779 | 4 |
| Oct 7, 2011 | 118 | $757 | -83% | 1 | $757 | $20,542 | 5 |
| Oct 14, 2011 | 107 | $3,183 | +320% | 2 | $1,592 | $23,947 | 6 |
| Oct 21, 2011 | 109 | $2,226 | -30% | 1 | $2,226 | $27,461 | 7 |
| Nov 4, 2011 | 84 | $4,917 | 2 | $2,459 | $32,760 | 9 | |
| Nov 11, 2011 | 102 | $1,275 | -74% | 1 | $1,275 | $38,231 | 10 |
| Nov 18, 2011 | 69 | $7,254 | +469% | 5 | $1,451 | $45,643 | 11 |
| Nov 25, 2011 | 70 | $6,604 | -9% | 2 | $3,302 | $53,991 | 12 |
| Dec 2, 2011 | 96 | $707 | -89% | 1 | $707 | $55,224 | 13 |
| Dec 9, 2011 | 95 | $998 | +41% | 1 | $998 | $56,222 | 14 |
| Dec 16, 2011 | 85 | $1,028 | +3% | 1 | $1,028 | $57,986 | 15 |
| Dec 23, 2011 | 76 | $290 | -72% | 1 | $290 | $58,728 | 16 |
| Dec 30, 2011 | 74 | $1,615 | +457% | 3 | $538 | $61,120 | 17 |
| Jan 6, 2012 | 71 | $3,631 | +125% | 3 | $1,210 | $65,121 | 18 |
| Jan 13, 2012 | 85 | $1,109 | -69% | 3 | $370 | $66,421 | 19 |
| Jan 27, 2012 | 91 | $553 | 1 | $553 | $68,083 | 21 | |
| Feb 3, 2012 | 92 | $115 | -79% | 1 | $115 | $68,285 | 22 |
| Feb 10, 2012 | 98 | $548 | +377% | 1 | $548 | $69,267 | 23 |
| Feb 17, 2012 | 98 | $677 | +24% | 1 | $677 | $69,944 | 24 |
| Feb 24, 2012 | 94 | $1,496 | +121% | 1 | $1,496 | $71,873 | 25 |
| Mar 2, 2012 | 103 | $786 | -47% | 1 | $786 | $72,742 | 26 |
| Mar 9, 2012 | 112 | $161 | -80% | 1 | $161 | $76,171 | 27 |
| Mar 23, 2012 | 101 | $266 | 1 | $266 | $76,447 | 29 | |
| Apr 6, 2012 | 96 | $982 | 1 | $982 | $77,617 | 31 | |
| Apr 20, 2012 | 105 | $554 | 1 | $554 | $78,672 | 33 | |
| May 11, 2012 | 110 | $595 | 1 | $595 | $80,017 | 36 | |
| Jun 1, 2012 | 108 | $659 | 1 | $659 | $81,212 | 39 |
Weekly Box Office Performance
| Date | Rank | Gross | % Change | Theaters | Per Theater | Total Gross | Week |
|---|---|---|---|---|---|---|---|
| Sep 9, 2011 | 94 | $7,087 | 2 | $3,544 | $7,087 | 1 | |
| Sep 16, 2011 | 115 | $2,015 | -72% | 2 | $1,008 | $9,102 | 2 |
| Sep 23, 2011 | 99 | $5,121 | +154% | 1 | $5,121 | $14,223 | 3 |
| Sep 30, 2011 | 90 | $5,562 | +9% | 2 | $2,781 | $19,785 | 4 |
| Oct 7, 2011 | 115 | $978 | -82% | 1 | $978 | $20,764 | 5 |
| Oct 14, 2011 | 100 | $4,324 | +342% | 2 | $2,162 | $25,235 | 6 |
| Oct 21, 2011 | 99 | $2,608 | -40% | 1 | $2,608 | $27,843 | 7 |
| Nov 4, 2011 | 80 | $9,113 | 2 | $4,557 | $36,956 | 9 | |
| Nov 11, 2011 | 100 | $1,434 | -84% | 1 | $1,434 | $38,390 | 10 |
| Nov 18, 2011 | 78 | $8,998 | +527% | 5 | $1,800 | $47,387 | 11 |
| Nov 25, 2011 | 71 | $7,131 | -21% | 2 | $3,566 | $54,517 | 12 |
| Dec 2, 2011 | 91 | $707 | -90% | 1 | $707 | $55,224 | 13 |
| Dec 9, 2011 | 87 | $1,734 | +145% | 1 | $1,734 | $56,958 | 14 |
| Dec 16, 2011 | 83 | $1,480 | -15% | 1 | $1,480 | $58,438 | 15 |
| Dec 23, 2011 | 82 | $1,067 | -28% | 1 | $1,067 | $59,505 | 16 |
| Dec 30, 2011 | 77 | $1,985 | +86% | 3 | $662 | $61,490 | 17 |
| Jan 6, 2012 | 71 | $4,723 | +138% | 3 | $1,574 | $66,213 | 18 |
| Jan 13, 2012 | 88 | $1,317 | -72% | 3 | $439 | $67,530 | 19 |
| Jan 27, 2012 | 84 | $640 | 1 | $640 | $68,170 | 21 | |
| Feb 3, 2012 | 87 | $549 | -14% | 1 | $549 | $68,719 | 22 |
| Feb 10, 2012 | 91 | $548 | n/c | 1 | $548 | $69,267 | 23 |
| Feb 17, 2012 | 107 | $1,110 | +103% | 1 | $1,110 | $70,377 | 24 |
| Feb 24, 2012 | 98 | $1,579 | +42% | 1 | $1,579 | $71,956 | 25 |
| Mar 2, 2012 | 85 | $4,054 | +157% | 1 | $4,054 | $76,010 | 26 |
| Mar 9, 2012 | 116 | $171 | -96% | 1 | $171 | $76,181 | 27 |
| Mar 23, 2012 | 102 | $454 | 1 | $454 | $76,635 | 29 | |
| Apr 6, 2012 | 100 | $1,483 | 1 | $1,483 | $77,930 | 31 | |
| May 4, 2012 | 107 | $750 | 1 | $750 | $79,422 | 35 | |
| May 11, 2012 | 106 | $1,131 | +51% | 1 | $1,131 | $80,553 | 36 |
Narrator
| Ryan Reynolds | Narrator |
Production and Technical Credits
| Michael Parfit | Director | |
| Suzanne Chisholm | Director | |
| Michael Parfit | Screenwriter | |
| Michael Parfit | Producer | |
| Suzanne Chisholm | Producer | |
| Ryan Reynolds | Executive Producer | |
| Scarlett Johansson | Executive Producer | |
| Eric Desatnik | Executive Producer | |
| Suzanne Chisholm | Executive Producer | |
| Michael Parfit | Editor | |
| David Parfitt | Composer | |
| Tobin Stokes | Composer | |
| Suzanne Chisholm | Director of Photography | |
| Michael Parfit | Director of Photography | |
| Alanna Komisar | Associate Producer | |
| Vicki Komisar | Associate Producer | |
| David Parfitt | Sound Mixer | |
| Frank Morrone | Re-recording Mixer | |
| Tony Gort | Re-recording Mixer | |
| David Parfitt | Sound Designer |
Cast and crew with above-the-line roles are marked in bold. The line marks the division between above-the-line and below-the-line roles.
Full financial estimates for this film, including domestic and international box office, video sales, video rentals, TV and ancillary revenue are available through our research services. For more information, please contact us at research@the-numbers.com.
Synopsis
Set on the rugged western coast of Vancouver Island and narrated by Ryan Reynolds, this documentary describes what happens when Luna, a baby orca, gets separated from his family and unexpectedly starts making contact with people along a scenic fjord called Nootka Sound. Because orcas are highly social beings who spend their lives traveling with their pods, Luna attempts to find a surrogate family among the area residents, much to their delight. But as word spreads about Luna, people become torn between their love for the lonely young whale and fears that human contact might harm him. As Luna’s determination and charm change human lives all around him and make the unexpected the norm on Nootka Sound, the film becomes an unforgettable narrative about the mysteries, the dangers —and the promise—of friendship across forbidden boundaries.
Metrics
| Opening Weekend: | $4,835 (6.0% of total gross) |
| Legs: | 11.20 (domestic box office/biggest weekend) |
| Domestic Share: | 100.0% (domestic box office/worldwide) |
| Theater counts: | 2 opening theaters/5 max. theaters, 9.2 weeks average run per theater |
| Infl. Adj. Dom. BO | $122,363 |
Movie Details
| Domestic Releases: | September 9th, 2011 (Limited) by Paladin |
| Video Release: | December 4th, 2012 by Docurama Video |
| MPA Rating: | G (Rating bulletin 2147, 11/17/2010) |
| Running Time: | 85 minutes |
| Cast, crew, or production detail: | Animal Lead, Voiceover/Narration |
| Plot point: | Animal Rights |
| Source: | Based on Real Life Events |
| Genre: | Documentary |
| Production Method: | Live Action |
| Creative Type: | Factual |
| Production/Financing Companies: | Telefilm Canada, Theatrical Documentary Program, Mountianside Films |
| Production Countries: | Canada |
| Languages: | English |
Weekend Box Office Performance
| Date | Rank | Gross | % Change | Theaters | Per Theater | Total Gross | Week |
|---|---|---|---|---|---|---|---|
| Sep 9, 2011 | 96 | $4,835 | 2 | $2,418 | $4,835 | 1 | |
| Sep 16, 2011 | 115 | $1,394 | -71% | 2 | $697 | $8,481 | 2 |
| Sep 23, 2011 | 99 | $4,314 | +209% | 1 | $4,314 | $13,416 | 3 |
| Sep 30, 2011 | 91 | $4,556 | +6% | 2 | $2,278 | $18,779 | 4 |
| Oct 7, 2011 | 118 | $757 | -83% | 1 | $757 | $20,542 | 5 |
| Oct 14, 2011 | 107 | $3,183 | +320% | 2 | $1,592 | $23,947 | 6 |
| Oct 21, 2011 | 109 | $2,226 | -30% | 1 | $2,226 | $27,461 | 7 |
| Nov 4, 2011 | 84 | $4,917 | 2 | $2,459 | $32,760 | 9 | |
| Nov 11, 2011 | 102 | $1,275 | -74% | 1 | $1,275 | $38,231 | 10 |
| Nov 18, 2011 | 69 | $7,254 | +469% | 5 | $1,451 | $45,643 | 11 |
| Nov 25, 2011 | 70 | $6,604 | -9% | 2 | $3,302 | $53,991 | 12 |
| Dec 2, 2011 | 96 | $707 | -89% | 1 | $707 | $55,224 | 13 |
| Dec 9, 2011 | 95 | $998 | +41% | 1 | $998 | $56,222 | 14 |
| Dec 16, 2011 | 85 | $1,028 | +3% | 1 | $1,028 | $57,986 | 15 |
| Dec 23, 2011 | 76 | $290 | -72% | 1 | $290 | $58,728 | 16 |
| Dec 30, 2011 | 74 | $1,615 | +457% | 3 | $538 | $61,120 | 17 |
| Jan 6, 2012 | 71 | $3,631 | +125% | 3 | $1,210 | $65,121 | 18 |
| Jan 13, 2012 | 85 | $1,109 | -69% | 3 | $370 | $66,421 | 19 |
| Jan 27, 2012 | 91 | $553 | 1 | $553 | $68,083 | 21 | |
| Feb 3, 2012 | 92 | $115 | -79% | 1 | $115 | $68,285 | 22 |
| Feb 10, 2012 | 98 | $548 | +377% | 1 | $548 | $69,267 | 23 |
| Feb 17, 2012 | 98 | $677 | +24% | 1 | $677 | $69,944 | 24 |
| Feb 24, 2012 | 94 | $1,496 | +121% | 1 | $1,496 | $71,873 | 25 |
| Mar 2, 2012 | 103 | $786 | -47% | 1 | $786 | $72,742 | 26 |
| Mar 9, 2012 | 112 | $161 | -80% | 1 | $161 | $76,171 | 27 |
| Mar 23, 2012 | 101 | $266 | 1 | $266 | $76,447 | 29 | |
| Apr 6, 2012 | 96 | $982 | 1 | $982 | $77,617 | 31 | |
| Apr 20, 2012 | 105 | $554 | 1 | $554 | $78,672 | 33 | |
| May 11, 2012 | 110 | $595 | 1 | $595 | $80,017 | 36 | |
| Jun 1, 2012 | 108 | $659 | 1 | $659 | $81,212 | 39 |
Weekly Box Office Performance
| Date | Rank | Gross | % Change | Theaters | Per Theater | Total Gross | Week |
|---|---|---|---|---|---|---|---|
| Sep 9, 2011 | 94 | $7,087 | 2 | $3,544 | $7,087 | 1 | |
| Sep 16, 2011 | 115 | $2,015 | -72% | 2 | $1,008 | $9,102 | 2 |
| Sep 23, 2011 | 99 | $5,121 | +154% | 1 | $5,121 | $14,223 | 3 |
| Sep 30, 2011 | 90 | $5,562 | +9% | 2 | $2,781 | $19,785 | 4 |
| Oct 7, 2011 | 115 | $978 | -82% | 1 | $978 | $20,764 | 5 |
| Oct 14, 2011 | 100 | $4,324 | +342% | 2 | $2,162 | $25,235 | 6 |
| Oct 21, 2011 | 99 | $2,608 | -40% | 1 | $2,608 | $27,843 | 7 |
| Nov 4, 2011 | 80 | $9,113 | 2 | $4,557 | $36,956 | 9 | |
| Nov 11, 2011 | 100 | $1,434 | -84% | 1 | $1,434 | $38,390 | 10 |
| Nov 18, 2011 | 78 | $8,998 | +527% | 5 | $1,800 | $47,387 | 11 |
| Nov 25, 2011 | 71 | $7,131 | -21% | 2 | $3,566 | $54,517 | 12 |
| Dec 2, 2011 | 91 | $707 | -90% | 1 | $707 | $55,224 | 13 |
| Dec 9, 2011 | 87 | $1,734 | +145% | 1 | $1,734 | $56,958 | 14 |
| Dec 16, 2011 | 83 | $1,480 | -15% | 1 | $1,480 | $58,438 | 15 |
| Dec 23, 2011 | 82 | $1,067 | -28% | 1 | $1,067 | $59,505 | 16 |
| Dec 30, 2011 | 77 | $1,985 | +86% | 3 | $662 | $61,490 | 17 |
| Jan 6, 2012 | 71 | $4,723 | +138% | 3 | $1,574 | $66,213 | 18 |
| Jan 13, 2012 | 88 | $1,317 | -72% | 3 | $439 | $67,530 | 19 |
| Jan 27, 2012 | 84 | $640 | 1 | $640 | $68,170 | 21 | |
| Feb 3, 2012 | 87 | $549 | -14% | 1 | $549 | $68,719 | 22 |
| Feb 10, 2012 | 91 | $548 | n/c | 1 | $548 | $69,267 | 23 |
| Feb 17, 2012 | 107 | $1,110 | +103% | 1 | $1,110 | $70,377 | 24 |
| Feb 24, 2012 | 98 | $1,579 | +42% | 1 | $1,579 | $71,956 | 25 |
| Mar 2, 2012 | 85 | $4,054 | +157% | 1 | $4,054 | $76,010 | 26 |
| Mar 9, 2012 | 116 | $171 | -96% | 1 | $171 | $76,181 | 27 |
| Mar 23, 2012 | 102 | $454 | 1 | $454 | $76,635 | 29 | |
| Apr 6, 2012 | 100 | $1,483 | 1 | $1,483 | $77,930 | 31 | |
| May 4, 2012 | 107 | $750 | 1 | $750 | $79,422 | 35 | |
| May 11, 2012 | 106 | $1,131 | +51% | 1 | $1,131 | $80,553 | 36 |
Narrator
| Ryan Reynolds | Narrator |
Production and Technical Credits
| Michael Parfit | Director | |
| Suzanne Chisholm | Director | |
| Michael Parfit | Screenwriter | |
| Michael Parfit | Producer | |
| Suzanne Chisholm | Producer | |
| Ryan Reynolds | Executive Producer | |
| Scarlett Johansson | Executive Producer | |
| Eric Desatnik | Executive Producer | |
| Suzanne Chisholm | Executive Producer | |
| Michael Parfit | Editor | |
| David Parfitt | Composer | |
| Tobin Stokes | Composer | |
| Suzanne Chisholm | Director of Photography | |
| Michael Parfit | Director of Photography | |
| Alanna Komisar | Associate Producer | |
| Vicki Komisar | Associate Producer | |
| David Parfitt | Sound Mixer | |
| Frank Morrone | Re-recording Mixer | |
| Tony Gort | Re-recording Mixer | |
| David Parfitt | Sound Designer |
Cast and crew with above-the-line roles are marked in bold. The line marks the division between above-the-line and below-the-line roles.
Full financial estimates for this film, including domestic and international box office, video sales, video rentals, TV and ancillary revenue are available through our research services. For more information, please contact us at research@the-numbers.com.