March 5th, 2010
While the Independent Spirit Awards are one of the first to announce their nominations, they are one of the last to hand out the awards. This year the clear winner was Precious, which swept all five categories it was nominated for. However, it wasn't the only winner.
More...
January 12th, 2010
The WGA announced their nominations this week, which include eleven awards, three of which are for theatrical releases.
More...
December 28th, 2009
The Tuesday after Christmas might seem a strange week to release a DVD or Blu-ray because it's too late to be a Christmas gift.
On the other hand, it's perfect for Boxing Week sales.
Overall we have a very short list this week, but there are still a few releases of note, including 9, which is bit expensive on Blu-ray, but still Pick of the Week material.
Meanwhile, Paranormal Activity is also a Pick of the Week contender, but the screener is late, so I can't say for sure.
I blame the Christmas shipping rush for the delay in getting here.
More...
December 21st, 2009
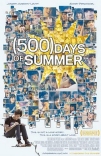
Talk about last minute gift ideas. In fact, if you buy gifts online, it will be too late to grab these, because it would take too long to ship them to you. As such, there are a number of prime releases as studios hope to attract last minute gift givers, but also a few that feel like they are being dumped here as an early Boxing Week sales. At the top of the list we have (500) Days of Summer on DVD or Blu-ray + Digital Copy and District 9 on Blu-ray. (The latter is also coming out on DVD, but the Blu-ray is by far the best deal.) Both are worthy of the DVD Pick of the Week. Meanwhile, if you are Canadian, or a fan of Canadian culture, grab Trailer Park Boys 2 - Countdown to Liquor Day on Blu-ray, which is the ever-popular DVD Puck of the Week.
More...
December 19th, 2009
It is very hard for a film to break out of limited release and become a legitimate mainstream hit. However, that is exactly what (500) Days of Summer did. It opened in July in just a couple of dozen theaters, but at its peak it reached the top ten and played in more than 1,000 theaters, while it earned more than $30 million at the box office.
And now with more than a couple of major nominations during Awards Season so far, it appears the film will be a success in that regard as well.
Obviously the majority opinion of the movie is strong, but will my voice be added to that choir?
Will the DVD be worth picking up, or will a rental be enough?
How about the Blu-ray, will it be worth the extra cash?
More...
December 16th, 2009
The Hollywood Foreign Press Association announced their nominations this week, but looking over the list of films chosen, it is hard to declare any one film as the big winner. Up in the Air did pick up six Golden Globe nominations, including several of the most prestigious nominations, but it is far from the only major player.
More...
December 2nd, 2009
As always, the Independent Spirit Awards represent the unofficial start of Awards Season with the announcement of their nominations.
This year The Last Station and Precious topped the list of nominees with five each.
For the former, it should help build buzz for its 2010 release.
For the latter, it is the first step towards possible Awards Season glory and further enhances its already lofty box office potential.
More...
October 11th, 2009
Le Petit Nicolas debuted in sixth place internationally with $9.39 million on 618 screens in 3 markets. Of that total, $8.88 million was earned on 571 screens in France, which was more than five times the amount earned by the second place film.
More...
October 4th, 2009
District 9 climbed into sixth place with $6.19 million on 2547 screens in 35 markets for a total of $56.88 million. This includes a fifth place, $926,000 opening on 253 screens in Italy, while it added $1.94 million on 448 screens during the full week in France for a total of $6.05 million after two.
More...
September 26th, 2009
Vicky the Viking fell to sixth place with 7.40 million on 898 screens in 3 markets for a total of $24.55 million. Of that, $5.92 million was earned on 751 screens in Germany and it now has $18.94 million in its native market.
More...
September 16th, 2009
Crude topped the per theater charts with $16,595 in its one theater. The overall box office leader, I Can Do Bad All By Myself, also topped the $10,000 mark with an average of $10,398.
More...
September 12th, 2009
The Proposal had massive gains this past weekend and just failed to reach the top five with $5.83 million on 2160 screens in 42 markets for a total of $124.60 million internationally and $285.57 million worldwide. It is now the biggest worldwide hit for Sandra Bullock, and it still has a chance to overtake Speed internationally. This week it debuted in third place in Italy with $1.43 million on 354 screens over the weekend for a total of $1.86 million during its opening, which is much weaker than its performance here. It has yet to open in France, which is key in its quest to overtake Speed, but even if it bombs there and in Japan, it will still hit $300 million worldwide.
More...
September 1st, 2009
This proved to be a bumper weekend for movies in limited release.
The September Issue was the number one film on the per theater chart, and it won by a huge margin with an average of $36,736 to an average of $12,133 for Big Fan. The Headless Woman was right behind with $11,862 in one theater. Der Baader Meinhof Komplex grew over the weekend to earn $10,564. Brighton Rock returned to the $10,000 club with $10,392 in one theater. And Still Walking was the final film in the $10,000 club, earning an average of $10,149 in two theaters.
More...
August 26th, 2009
My One and Only opened on top of the per theater chart with an average of $14,673 in four theaters. This is a better start than expected for the film. The only other member of the $10,000 club was the overall box office champion, Inglourious Basterds, which opened with an average of $12,024.
More...
August 18th, 2009
It Might Get Loud led the way on the Per Theater Chart with an average of $13,240 in seven theaters, which suggests some potential for expansion. District 9 was relatively close behind with an average of $12,251.
More...
August 11th, 2009
Not only did G.I. Joe: The Rise of Cobra win the race to the top of the overall box office chart, it was also the only film to crack the $10,000 mark on the per theater chart.
Its average of $13,654 was about 50% more than the second place film, Cold Souls, which opened with an average of $9,043 in 7 theaters.
More...
August 11th, 2009
G.I. Joe: The Rise of Cobra topped expectations and that helped 2009 finally snap its month-long slump at the box office. Overall the industry brought in $146 million, which was 17% higher than last weekend, and more importantly, 22% higher than the same weekend last year. Year-to-date, 2009 has brought in $6.64 billion, which is 6.6% higher than 2008's pace; however, while that's impressive, it is seriously off its highs for the year and 2009 will need to work to make sure ticket sales don't fall behind last year's pace.
More...
August 4th, 2009
Summer might be ending, but that doesn't mean there isn't a lot of activity on the per theater chart. Placing first was Adam with an average of $17,094 in four theaters. This suggests at least some potential to expand. The same can be said of The Cove and its average of $14,410; however, as a documentary, there is a lower upper limit to its box office potential. Thirst was right behind with an average of $13,972, which is better than Let the Right On In opened with. Finally, (500) Days of Summer remained in the $10,000 club for one more week with an average of $10,439 in 266 theaters.
More...
July 28th, 2009
In the Loop lead the way on the per theater chart with an impressive average of $23,983, and with its reviews, it should be able to expand significantly. (500) Days of Summer landed in second place with an average of $19,244, which is about a third less than its opening weekend average. But it is now playing in 85 theaters, which is more than triple its opening weekend theater count, so this is a fantastic hold. Those were the only films to top $10,000 on the per theater chart, but The Ugly Truth came relatively close with $9,579.
More...
July 21st, 2009
(500) Days of Summer led the way on the per theater chart with an outstanding average of $30,907, which was nearly twice as much as the second placed film.
That honor went to the overall box office champion film, Harry Potter and the Half-Blood Prince, which earned an average of $17,997.
Alien Trespass skyrocketed into third place with $14,405 in one theater thanks to special screenings at the Fantasia Montreal Film Festival.
The final film to reach the $10,000 mark was A Woman in Berlin with $12,439, also in one theater.
More...
July 20th, 2009
July 19th, 2009
Harry Potter and the Half-Blood Prince has posted a $79.5 million opening weekend, according to Warner Bros.' estimate released on Sunday.
The movie's daily box office was an estimated $26.8 million on Friday, $29.2 million on Saturday and $23.4 million on Sunday -- and represents a remarkable level of consistency over the first five days in release, after a huge performance at midnight screenings on Wednesday.
The five-day total of $159.7 million is a new record for the franchise at this stage of a run (see comparison chart for Harry Poter Movies), although it does leave the movies somewhat behind the blistering early pace of The Dark Knight and Transformers: Revenge of the Fallen.
More...
July 19th, 2009
What is likely the last monster hit of the summer came out this week, Harry Potter and the Half-Blood Prince, but its Official Site is only average compared to most saturation level releases and weak compared to most previous sites from the franchise.
More...
July 17th, 2009
There are fewer than 500 limited releases coming out this week; in fact, we have fewer than five on this week's list. However, almost all of them are earning strong reviews, and one of the them, (500) Days of Summer, could be the sleeper hit of the summer.
More...
July 15th, 2009
July 1st, 2009
June gave us some unexpected hits in The Proposal and The Hangover, as well as expected hits like Up, not to mention the biggest hit of the year, so far, in Transformers - Revenge of the Fallen. However, despite this, 2009 lost a bit of ground to 2008, and this will likely continue this month, as this month last year saw the release of The Dark Knight.
This year we have a couple of potential $300 million hits, but nothing likely to perform on that scale.
Then again, I only predicted Dark Knight would make $250 million, so we could be surprised again this year.
The box office is certainly hot, and is currently running more than 12% ahead of last year's pace.
More...