March 6th, 2012
The number of big releases coming out this week can be counted on the fingers of one hand. The biggest theatrical release of the week is Immortals, but its reviews were weak enough that I think it might struggle on the home market in comparison. There are also a few catalog titles coming out on Blu-ray that are note-worthy, like To Catch a Thief. However, by far the biggest release, and the best, is Game of Thrones: Season One on DVD or Blu-ray, the latter of which is the Pick of the Week with To Catch a Thief not too far behind.
More...
March 3rd, 2012
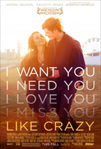
Like Crazy had advance buzz that most limited releases could only dream of. It even earned some Award Season buzz. It did earn some awards at film festivals and critics associations; however, it was shut out at the majors. Likewise, it earned $3 million at the box office, which is great compared to most limited releases, but wasn't able to truly escape the art house circuit. Did it deserve to win a few more awards and reach a few more major milestones? Or did it over-perform compared to its quality?
More...
December 14th, 2011
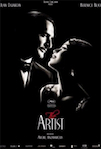
Three new releases were able to reached the $10,000 mark on the per theater chart, while there were three holdovers that were able to join them. Leading the way was Tinker Tailor Soldier Spy with an outstanding average of $77,641 in four theaters. Young Adult opened with nearly the same total, but was playing in eight theaters giving it an average of $38,783. We Need to Talk About Kevin earned $24,587 in one theater during its Oscar qualifying run. A Dangerous Method spent its third weekend in the $10,000 club with an average of $19,234 in four theaters. However, it has seen in per theater average cut by more than half since its opening, and it has yet to expand. The Artist has also seen its per theater average fall, but it expanded its theater count to sixteen this past weekend and still earned an average of $18,460. It is already an art house success and will soon start earning some measure of mainstream success. Shame more than doubled its theater count, but hung onto a spot in the $10,000 club with an average of $13,496 in 21 theaters.
More...
November 30th, 2011
The top film on the per theater chart was a silent film, The Artist, which was amazing, earning more than $200,000 in just four theaters for an average of $51,220. A Dangerous Method was also very strong on the per theater chart earning an average of $41,988, also in four theaters. Last week's winner, The Descendants, expanded into nearly 400 theaters, but still managed an average of $18,835. Finally, the overall box office leader, The Twilight Saga: Breaking Dawn, Part 1, managed an average of $10,252.
More...
November 16th, 2011
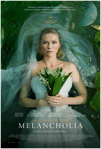
Melancholia led the way on the per theater chart with an average of $13,535 in 19 theaters. It was playing in more theaters than most limited releases debut in, but for a film with Oscar aspirations, this was a weaker result that I would have liked. It also might hurt the film's Oscar chances; after all, people can't vote for films they haven't seen. The overall box office leader, Immortals, placed second with an average of $10,349, which is about $3,000 more than I was expecting.
More...
November 8th, 2011
Like last week, Like Crazy was the only film to reach the $10,000 on the per theater chart. It expanded from four to sixteen theaters, while its per theater average remained strong at $16,657. The only new release that came close to $10,000 was The Other F Word and it was well back with an average of $6,643 in two theaters.
More...
November 6th, 2011
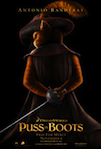
After a disappointing opening weekend, Puss in Boots is on its way to posting a redeeming second weekend, according to Paramount's Sunday estimate. The Shrek spin-off is projected to $33.035 million, down just 3% from its opening. That is in part a reflection of better weather on the East Coast, which also helped returners such as In Time (down 36%), Footloose (down 17%) and Courageous (down 16%). But it also suggests a very healthy run is in prospect. Tales of the demise of DreamWorks Animation last week may have been premature.
More...
November 1st, 2011
Like Crazy was the only film to reach the $10,000 mark on the per theater chart, but was stellar with an average of $30,785 in four theaters. Its reviews suggest it will be able to expand somewhat, but it's a little too weak to be an Awards Season player. While it didn't get to the $10,000 mark, Ra. One came relatively close to reaching the top ten with $1.65 million in 189 theaters over the weekend for an average of $8,751. That's amazing for this type of film and it deserves a special mention.
More...
October 30th, 2011
Although it's perhaps an exaggeration to call it the start of the Holiday Season, Puss in Boots' debut this weekend was intended to give Dreamworks Animation a head start on what will be a very competitive season, and it looks as though it can be called a moderate success. The Shrek spin-off will earn an estimated $34 million this weekend, which should put it on track to earn comfortably over $100 million during its run in domestic theaters. While that's a very respectable performance for October, it pales in comparison to other films in the franchise. Even Shrek Forever After more than doubled that number, and the original Shrek posted over $42 million in 2001. So it's far from certain that this will be the start of a long-lived offshot for the franchise.
More...
October 28th, 2011
For the second week in a row, there are too many limited releases trying to divide up the limited marketplace. It's not quite as busy as last weekend, but the number of limited releases did hit double-digits, including four opening in dozens of theaters, of two of those for opening in more than 100. Again like last weekend, there are films earning advance buzz, films earning good reviews and films with casts with strong name recognition. However, there are few that have even two of those three. Like Crazy comes the closest to earning all three, while Ra. One could have some crossover success.
More...