
Synopsis
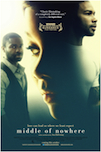
What happens when love takes you places you never thought you would go? As Ruby rides a bus through the streets of Compton, she wills herself to push away the memories that crowd her. Four years earlier, she was a vibrant medical student married to the love of her life, Derek. Now, she makes her way to the maximum security prison on the outskirts of town. This is where her love now resides. Behind coiled razor wire and forty foot concrete walls. As the couple stares into the hallow end of an eight-year prison sentence, Ruby must learn to live another life, one marked by shame and separation, by guilt and grief. Soon, her singular focus is to ensure Derek's survival in his violent new environment. She drops out of school to maintain her marriage from beyond bars. She becomes a part of a little known community of women-in-waiting, bonded together by a deeply-rooted sense of loss. She fights to support her husband on the inside and survive her own identity crisis on the outside. Through a chance encounter and a stunning betrayal that shakes her to the core, Ruby is propelled in new and, often frightening, directions of self-discovery. And as we chronicle her turbulent yet transformative journey, we witness the emergence of a broken woman made whole.
Metrics
| Opening Weekend: | $67,909 (28.7% of total gross) |
| Legs: | 3.49 (domestic box office/biggest weekend) |
| Domestic Share: | 100.0% (domestic box office/worldwide) |
| Production Budget: | $200,000 (worldwide box office is 1.2 times production budget) |
| Theater counts: | 6 opening theaters/24 max. theaters, 2.5 weeks average run per theater |
| Infl. Adj. Dom. BO | $320,694 |
Latest Ranking on Cumulative Box Office Lists
| Record | Rank | Amount |
|---|---|---|
| All Time Domestic Box Office (Rank 11,201-11,300) | 11,235 | $236,806 |
| All Time Worldwide Box Office (Rank 20,701-20,800) | 20,749 | $236,806 |
| All Time Domestic Highest Grossing Limited Release Movies (Rank 3,401-3,500) | 3,415 | $236,806 |
| All Time Domestic Box Office for R Movies (Rank 4,001-4,100) | 4,004 | $236,806 |
| All Time Worldwide Box Office for R Movies (Rank 4,701-4,800) | 4,725 | $236,806 |
See the Box Office tab (Domestic) and International tab (International and Worldwide) for more Cumulative Box Office Records.
Watch Now On
| iTunes: | iTunes |
| Vudu: | Vudu |
| Netflix: | Netflix, Netflix |
Movie Details
| Domestic Releases: | October 12th, 2012 (Limited) by AFFRM |
| Video Release: | January 13th, 2015 by Lionsgate Home Entertainment |
| MPAA Rating: | R for some language. (Rating bulletin 2235, 8/8/2012) |
| Running Time: | 99 minutes |
| Comparisons: | vs. Like Crazy Create your own comparison chart… |
| Keywords: | African Americans, Prison, Relationships Gone Wrong, Love Triangle |
| Source: | Original Screenplay |
| Genre: | Drama |
| Production Method: | Live Action |
| Creative Type: | Contemporary Fiction |
| Production/Financing Companies: | Kandoo Films, Forward Movement, Participant Media |
| Production Countries: | United States |
| Languages: | English |