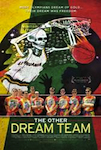
Synopsis
After leading the USSR to a gold medal (and victory over the U.S.A.) at the 1988 Olympics in Seoul, Sarunas Marciulionis and Arvydas Sabonis were poster boys for their oppressor’s sports machine. Four year later, after the fall of the Soviet Union, they emerged as symbols of democracy, helping their country break free from the shackles of Communism, and willing newly independent Lithuania to the medal stand at the Barcelona Olympics. “The Other Dream Team” documents the Lithuanians’ experiences behind the Iron Curtain for 50 years, where elite athletes were subjected to brutalities of Communist rule. As they hid from KGB agents and feared for their lives, Lithuania’s basketball stars always shared a common goal—to utilize their athletic gifts to help free their country.
Metrics
| Opening Weekend: | $19,821 (14.8% of total gross) |
| Legs: | 4.82 (domestic box office/biggest weekend) |
| Domestic Share: | 42.6% (domestic box office/worldwide) |
| Production Budget: | $500,000 (worldwide box office is 0.6 times production budget) |
| Theater counts: | 2 opening theaters/14 max. theaters, 4.1 weeks average run per theater |
| Infl. Adj. Dom. BO | $181,611 |
Latest Ranking on Cumulative Box Office Lists
| Record | Rank | Amount |
|---|---|---|
| All Time Domestic Box Office (Rank 12,201-12,300) | 12,231 | $134,109 |
| All Time International Box Office (Rank 15,801-15,900) | 15,827 | $180,335 |
| All Time Worldwide Box Office (Rank 19,601-19,700) | 19,642 | $314,444 |
| All Time Domestic Highest Grossing Limited Release Movies (Rank 4,201-4,300) | 4,237 | $134,109 |
See the Box Office tab (Domestic) and International tab (International and Worldwide) for more Cumulative Box Office Records.
Movie Details
| Domestic Releases: | September 28th, 2012 (Limited) by Film Arcade |
| International Releases: | September 21st, 2012 (Wide) (Lithuania) |
| MPAA Rating: | Not Rated |
| Running Time: | 91 minutes |
| Comparisons: | vs. En kongelig affære Create your own comparison chart… |
| Keywords: | Basketball, Olympics, Underdog, Political, Rock 'n' Roll |
| Source: | Based on Real Life Events |
| Genre: | Documentary |
| Production Method: | Live Action |
| Creative Type: | Factual |
| Production/Financing Companies: | Basketball Future Foundation, Sorrento Prods, Berliner 76 Entertainment, Marius Markevicius |
| Production Countries: | Lithuania, United States |
| Languages: | English, Lithuanian |