April 7th, 2015
New releases earned the top three spots on the Blu-ray Sales Chart this week, including a tight race for top spot. Penguins of Madagascar earned first place over Exodus: Gods and Kings in terms of units, 269,000 vs 257,000. However, in terms of revenue, the pair finished in the reverse order at $5.91 million to $5.38 million. As far the their opening week Blu-ray shares are concerned, Penguins managed a very strong 58%, while Exodus managed a very healthy 54%
More...
March 17th, 2015
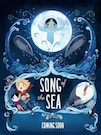
It's a busy / short week on the home market. There are four first-run releases coming out this week, which is more than most weeks. However, it is also a very shallow week and we run into filler on the first page of Amazon's list of best-selling new releases. The best of the first-run releases is Top Five, but the DVD or Blu-ray Combo Pack isn't quite Pick of the Week material. For that honor, we have to look to a smaller release, Song of the Sea on DVD or Blu-ray Combo Pack.
More...
February 4th, 2015
With our annual Oscar Prediction contest underway, now is the best time to look at the nominees and try and figure out who the favorites are and which films should just feel honored to be nominated. Today we look at Best Feature-Length Animated Film. For a while, it looked like The LEGO Movie would be the favorite to win the Oscar, then it wasn't even nominated. Because of that, it is a little hard to know what will happen going forward. There is one film that looks to be the favorite, but that was true before the nominations and nearly every expert got it wrong before.
More...
January 17th, 2015
The Oscar nominations were announced early in the morning, when all sensible people were asleep. There were some surprises, as well as some results that would have been surprises had it not been for the previous Awards Season nominations. Seventeen films earned two or more nods, led by Birdman and The Grand Budapest Hotel, both of which picked up nine nominations, while The Imitation Game was right behind with eight.
More...
January 13th, 2015
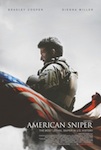
There was only one new release in the $10,000 club, which left American Sniper with an easy victory. It pulled in an average of $144,880 in four theaters, making it the first film ever to earn an per theater average of $100,000 or more for three weeks. Second place went to A Most Violent Year with an average of $29,135, also in four theaters. Taken 3 was the best of the new releases with an average of $10,908, just ahead of Song of the Sea with an average of $10,470.
More...
January 11th, 2015
The BAFTA nominations were announced yesterday and unlike most other Awards Season voters, the BAFTA voters gave us some real surprises. For instance, Birdman didn't lead the way. In fact, it was a comedy, The Grand Budapest Hotel, that earned the most nominations at 11. Granted, Birdman and The Theory of Everything were tied for second place with ten each, but it is still strange to see a comedy leading the way.
More...
January 10th, 2015
The Producers Guild of America nominations were announced and there's not a lot of surprises among the three categories. Birdman, Boyhood, The Imitation Game, and others continue to get accolades, but there are also some films that are being passed over too often.
More...
December 22nd, 2014
The $10,000 club was crowded this weekend with six films earning per theater averages of more than $10,000. This includes Inherent Vice, which led the way for the second time in a row earning an average of $29,055 in five theaters. This bodes well for its wide expansion in January. Speaking of expanding, The Imitation Game expanded from 25 theaters to 34 theaters earning an average of $25,253 in the process. It has already earned some measure of mainstream success and with room to grow, it will stay in theaters for a while. Mr. Turner was the best of the new limited releases earning an average of $21,728 in five theaters. Song of the Sea was next with $17,967 in one theater. The overall box office champ, The Hobbit: The Battle of the Five Armies, earned an average of $14,122, which is lower than anticipated, but still pretty good. Finally, P.K. opened with an average of $13,108 in 272 theaters. It is rare that we get to talk about a Bollywood film in the $10,000 club.
More...
December 21st, 2014
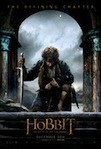
After thirteen years (with a lengthy break in the middle), Peter Jackson’s Middle Earth Saga finally comes to an end this weekend with The Hobbit: The Battle of the Five Armies. Tolkein/Jackson fans are giving the franchise a rousing farewell, with $50 million expected this weekend and $90 million in total after five days. Comparisons are a little difficult, because the previous Hobbit installments opened on Fridays, but Desolation of Smaug racked up $86 million in its first five days and An Unexpected Journey hit $100 million on its fifth day in release. So this outing seems set to perform similarly overall, with $250 million – $300 million domestically and around $1 billion worldwide. That will solidify the franchise as the fourth-most successful in history, and if it can top $1.079 billion in this outing, it will be the only franchise ever to average more than $1 billion globally per film.
More...
December 19th, 2014
It is not a super busy weekend, but that doesn't mean there's nothing worth checking out. Mr. Turner's reviews are incredible, so much so that I'm surprised it hasn't been a major player during Awards Season thus far. It isn't the only film earning great reviews, as both Song of the Sea and Winter's Sleep could find audiences in theaters.
More...