March 6th, 2012
The number of big releases coming out this week can be counted on the fingers of one hand. The biggest theatrical release of the week is Immortals, but its reviews were weak enough that I think it might struggle on the home market in comparison. There are also a few catalog titles coming out on Blu-ray that are note-worthy, like To Catch a Thief. However, by far the biggest release, and the best, is Game of Thrones: Season One on DVD or Blu-ray, the latter of which is the Pick of the Week with To Catch a Thief not too far behind.
More...
January 4th, 2012
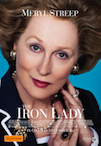
Iron Lady led a group of six films in the $10,000 earning a per theater average of $55,102. This is better than expected and shows the Oscar buzz for Meryl Streep is overcoming the middling overall reviews. Last week's winner, Pina, remained strong with an average of $23,874 in three theaters. I expect it will expand somewhat and earn a small measure of mainstream success. A Separation opened with an average of $19,827 in three theaters and with possible Oscar glory, it continues to do well. Tinker Tailor Soldier Spy has already earned a significant measure of mainstream success and with an average of $19,043 in 55 theaters this past weekend, it had its best weekend yet. It did cost $21 million to make, so it will need to continue to do well for quite some time before it makes profitability likely. Extremely Loud and Incredibly Close's first full weekend went well earning an average of $18,463 in three theaters. It has a shot at expanding wide in a couple weeks, assuming it holds on relatively well over the next couple weeks. The final film in the $10,000 club was Pariah, which earned an average of $12,145 in four theaters. It earned just over $100,000 from Wednesday through Monday.
More...
December 16th, 2011
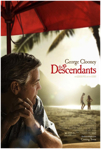
The Hollywood Foreign Press Association announced their nominations and the Awards Season picture started to look a whole lot clearer. The Artist led the way with six nominations, while The Descendents and The Help were right behind with five apiece.
More...
November 23rd, 2011
There were only two films that were able to crack the $10,000 club this weekend, but they were both huge hits. The Descendants opened with more than $1 million in 29 theaters, for an average of $41,038. Add in the film's reviews and its Awards Season buzz and there's little doubt that the film will expand wide. Speaking of wide, the only other film in the $10,000 club was The Twilight Saga: Breaking Dawn, Part 1. The overall box office leader took in $138 million in 4,061 theaters, for an average of $34,012.
More...
November 8th, 2011
Like last week, Like Crazy was the only film to reach the $10,000 on the per theater chart. It expanded from four to sixteen theaters, while its per theater average remained strong at $16,657. The only new release that came close to $10,000 was The Other F Word and it was well back with an average of $6,643 in two theaters.
More...
October 25th, 2011
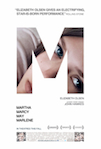
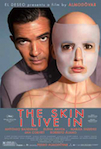
Martha Marcy May Marlene was one of five films to top $10,000 on the per theater chart leading the way with $34,413. Combining the film's opening with its reviews and it suggests serious potential for expansion. Being Elmo: A Puppeteers Journey opened with $22,963 in its lone theater, which is surprisingly strong. The overall box office leader, Paranormal Activity 3, was next with $15,829. Last week's winner on the per theater chart, The Skin I Live In, remained strong with an average of $11,771 in 21 theaters. Further expansion is likely, as it is earning some measure of mainstream success, but its bizarre subject matter will prevent it from truly escaping the art house circuit. Margin Call was a surprise entrant in the $10,000 club, as it was playing in 56 theaters, which is a lot for a limited release. Its opening weekend average of $10,034 and excellent reviews suggests some potential to expand, while reaching $1 million should happen sometime during the upcoming weekend.
More...
October 23rd, 2011
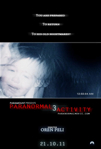
After a poor September and slow start to October, Paranormal Activity 3 put some life back in to the movie industry this weekend with a huge $54 million opening weekend, according to Paramount's Sunday estimate. That's comfortably a record for the franchise and will almost certainly top Jackass 3D to become the biggest October's biggest weekend too. With no other horror flick coming out between now and Halloween, it should be set for a comfortable $100 million or so at the box office (on a budget of $5 million).
More...
October 18th, 2011
There was only one film to top $10,000 on the per theater chart this weekend. The Skin I Live In had a big name director, big name star, excellent reviews, and a lot of buzz thanks to a controversial plot. This added up to an opening of $233,000 in six theaters for an average of $37,187. This suggests it will perform very well on the art house circuit, but this is a film that will never play to wide audiences.
More...
October 16th, 2011
A decent opening for the Footloose remake wasn't quite enough to take top spot at the box office this weekend thanks to a good second weekend for Real Steel. The inspirational robot boxing movie dropped 40% from its debut to $16.3 million, which will most likely be enough to keep Footloose in second place. It is projected to make $16.1 million this weekend. Well behind them is The Thing, which is expected to make just $8.7 million. Thanks to the general weakness of the market, that's going to be enough for third, but it's not going to make much of a dent in the marketing costs for the movie, let alone its production costs.
More...
October 14th, 2011
There are quite a few limited releases coming out this week that have earned advance buzz, or have casts with strong name recognition, or are earning strong reviews. There are a few that have two, but only one film has all three. The Skin I Live In is the lone film to earn the trifecta, but this film has a difficult premise to overcome if it wants to earn any real measure of mainstream success. Perhaps some of the other films will mange to translate buzz into ticket sales, but that rarely lasts long.
More...