July 28th, 2005
During the past week promotional websites for several movies were launched and some older ones added additional content. Here the list of this week's releases, a couple of new sites and few updates, including this week's winner,
Sky High -
Official Site.
More...
June 5th, 2005
It was a slightly busier weekend as several studios were brave enough, or foolhardy enough to try and sandwich their film between the worldwide release of
Revenge of the Sith and
Batman Begins, which debuts in just 10 days. With
War of the Worlds' worldwide release just two weeks after that, there's very little room for smaller films to survive.
More...
May 29th, 2005
Revenge of the Sith dominated nearly every market it opened in and in most of them it was the only new film in the top ten. Because of this there's almost no international details to report and those details that are available are single market releases.
More...
May 22nd, 2005
It was another slow weekend for international details as few studios were brave enough, or foolish enough to try and squeeze in a release between
Kingdom of Heaven and
Revenge of the Sith. It was hard to find many films that earned more than $1 million over the weekend and most of the activity came from smaller releases in midlevel markets. Next weekend there could be even fewer details as
Revenge of the Sith should dominate every market, but after that the summer blockbuster season should be in full swing and things should pick up.
More...
May 16th, 2005
The summer got off to a really, really slow start international this week and while
Kingdom of Heaven didn't wasn't quite the blockbuster most people were looking for, it did cannibalized what little box office there was. There were a few local films to make noise, including Negotiator: Bayside Shakedown 3, which easily topped the Japanese market with $5,275,685 on just 280 for a huge $18,842 per screen average.
More...
May 14th, 2005
Just one new film managed to finish in the top five on the rental charts, but it easily took top spot.
National Treasure was more than 50% higher than its nearest rival with $10.57 million in DVD rentals and $1.46 million in VHS rentals for $12.03 million total. The film also finished first in DVD sales and second in VHS sales, (behind
The Incredibles.)
More...
May 7th, 2005
There were three new films in the top five rentals this week but
Meet the Fockers held them off taking top spot. The film added $9.39 million in DVD rentals and $1.54 million in VHS rentals for a combined $10.93 million, down just 11% from last weekend.
More...
April 25th, 2005
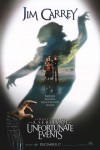
Every week films get a second chance at success from the home market; or, in some cases, a first chance at success. Here is a list of wide releases, limited releases, classics and a few from the growing TV on DVD section. There are quite a few DVDs that piqued my interest this week, but there was only one that jumped out as a must buy: Lemony Snicket's A Series of Unfortunate Events - 2-Disc Special Collector's Edition
More...
April 3rd, 2005
Million Dollar Baby performed brilliantly this week earning $8.8 million for an international total of $60 million, placing fourth on the international box office charts. In France the film dominated the marketplace with $4.94 million on 450 screens and in Germany the film earned $760,000 in semi-limited release (120 screens) for the best per screen average in the market. On the other hand, the film flopped in Slovakia where it missed the top ten in its debut. On the holdover front, the multi-
Oscar winning front saw its weekend haul climb by 20% in Spain to $980,000 and it's still doing well in Australia, Italy and South Korea.
More...
March 27th, 2005
Million Dollar Baby has again slipped off the radar screen, but we do know it hit $52 million internationally, which means it made $9 million during the week. The film didn't earn $1 million in any single market, but is still doing strong in South Korea, ($970,000), Spain, ($840,000), Italy, ($600,000) and Australia, ($350,000.) Best estimate has the film earning just shy of $5 million of that over the weekend and taking sixth place on the international box office charts.
More...
February 27th, 2005
The Aviator started out Oscar evening extremely well, but it was Million Dollar Baby that won the biggest prizes at the 77th annual Academy Awards.
More...
February 27th, 2005
Ocean's Twelve may have dropped out of the top five, but it is still going strong with $4.5 million on 1400 screens in 35 markets for an international box office of $225.8 million so far. No new openings means the
heist film had to rely on holdovers likes its $2.5 million during its third weekend in the U.K. and $1.4 million during its fifth week of release in Japan, finishing second in both those markets.
More...
February 20th, 2005
Iznogoud: Calife a la place du calife, a movie based on a Asterix and Obelix
spin off of sorts, dominated the French box office taking in $7.1 million, more than double the second place film and more than a third of the top ten total. It is also enough to push it into the
Top Five on the international scene, dropping
Finding Neverland into sixth place. Unfortunately, like the several films made in the Asterix and Obelix series, this one is unlikely to make much of an impact outside the French speaking markets.
More...
February 9th, 2005
A higher than expected opening in Spain and a lower than expected decline in the U.K. allowed
Meet the Fockers to retain top spot on the international charts. The film opened first in a handful of markets, including a $4.7 million opening in Spain on 356 screens, $377,000 in Denmark, $352,000 in Taiwan and $275,000 in Israel. Its most prolific market continues to be the U.K. where the film brought in $8.5 million during its second weekend there; that's a 42% drop-off, which is a little high for the market, but not as high as expected given its huge start last weekend. That one market represented more than half of its weekend total of $16.3 million on 1700 screens in 28 markets for a running tally of $82.9 million.
More...
February 2nd, 2005
Meet the Fockers open in the U.K. over the weekend with an astounding $14.8 million on 456, which is more than four times the
original's earnings there in 2000.
That figure was also more than 8 times the second place film , and more than half the market's total box office.
Add in a handful of openings in other, mostly smaller markets and the film brought in $19.2 million on 1,700 screens in 15 markets for a $58.8 million total so far.
More...
January 26th, 2005
The International Box Office Race is certainly interesting, as Ocean's Twelve recaptured the lead this weekend with $14.4 million on 4,600 screens in 58 markets and now sits at $170.4 million internationally and $292.8 million worldwide. A large chunk of that total came from Japan, where the film earned $6.8 million (including sneak peaks) on 510 screens, while ending Howl's Moving Castle's nine week reign on top.
While this was a strong performance, it was 20% lower that the original's debut in the same market.
More...
January 25th, 2005
The Oscar Nominations were announced this morning and at first glance it appears that most of the nominations went to films with smaller budgets and box office results.
Box office hits were nearly shut out of the major nominations.
More...
January 19th, 2005
After a massive opening last week in Spain,
Alexander took top spot on the international charts thanks to a strong opening in Italy, Brazil and Hong Kong. The film managed first place in all three markets with $3.87 million on 446 screens in Italy, $906,900 on 193 screens in Brazil and $275,244 on 30 screens in Hong Kong. Holdovers were not as kind to the
Sword and Sandal epic as it dropped nearly 50% in the U.K., Spain and France. Overall the film brought in $14.5 million on 3600 screens in 51 markets for a running tally of $88 million. And while the film will easily cross $100 million internationally, which is roughly 3 times its domestic figure, it has to be looked at as a disappointment financially.
More...
January 12th, 2005
The race for first in the international marketplace continued to be close with three films within a couple million of each other. Leading the way was
Ocean's Twelve with $17.5 million on 5200 screens in 54 markets; the film's international total now sits at $137 million, slightly more than half of what
Ocean's Eleven finished with. The
heist film did open well in several markets, which mostly balances out severe drop-offs due to the post-holiday. For instance, the film opened well in South Korea with $2.1 million on 150 screens and debuted in first place in Argentina, ($500,000), Portugal, (with $720,000) and in the Philippines, ($370,000.)
More...
January 10th, 2005
2005 got off to a slow start and was off 19% from last weekend and 16% from the first weekend of 2004. This despite the one new release beating all expectations. Next weekend should really turn things around, on the other hand.
More...
January 7th, 2005
The weekend after Christmas is historically a very poor weekend to release a new film, as is the first weekend of the new year. Of course, normally these are the same weekend, but not this year. So by stretching out this down time we get two weekends in a row where's there's not much new to get bodies into theatres.
More...
January 3rd, 2005
Meet the Fockers dropped just 9.5% to $41.7 million and will easily make $200 million before its theatrical run is over. When it does it will become the six film from 2004 to do so, but at just
39% positive it will be the lowest rated film in that club.
More...
December 31st, 2004
It's the last day of 2004 tonight so you could either call this the last weekend of 2004 or the first weekend of 2005. There needed to be roughly $264 million in box office business since Sunday for 2004 to beat 2003, and while Monday's figures were ok, they've been slipping during the week and will most likely put 2003's $9.158 billion out of reach. As for the predictions this weekend, there should be almost no change in the top five but the overall box office should climb from last weekend.
More...
December 29th, 2004
Ocean's Twelve opening in another two markets, (Mexico and Belgium) helped the
heist film finish first on the international charts with $22.6 million on 5,183 screens in 46 markets. The film opened well in Belgium where it easily took first place with $1.2 million on just 75 screens. That's up nearly 40% compared to the the
original, but down nearly 10% in Euros. In Mexico the film could only manage $1.8 million on 550 screens for a rather limp per screen average. However, in most markets the film is not holding up as well as the studio would have liked. For instance, in Germany the film dropped by more than 50%, in France the decline was 44%. The only exception appears to be Italy where holidays and a serious boost to screen count helped the film climb 33% to $2.9 million over the weekend.
More...
December 27th, 2004
Despite records set for biggest Christmas Day box office, the total box office over the weekend was down significantly from last year.
This is partially due to Christmas Eve falling on a Friday, but also has to do with the poor selection of films being released.
The weekend was up by 27% from last weekend, but down 28% from last year, leaving 2004 just 0.4% up on 2003 with $8.894 billion to $8.854 billion.
With a lead of just $40 million going into the final stretch, 2004 will most likely finish slightly ahead of 2003 in terms of total box office, but will finish behind in term of ticket sales.
More...
December 24th, 2004
The busiest weekend of the year starts off with Christmas Eve, one of the slowest holiday nights of year. Because of this, it make predicting the weekend results much more difficult. Also adding to the difficulty, several films only open / go wide on Saturday.
More...
December 22nd, 2004
For the first time in many weeks there was a real race for top spot on the international charts, also, for the first time in many weeks
The Incredibles didn't win that race. Boosted by debuts in 22 additional markets,
Ocean's Twelve took top spot with $28.9 million on 3900 screens in 27 markets for a early total of $35.2 million. Compared to the
original the results are mixed. IN many places it is a lot lower when compared in local currency, but thanks to the Dollar's extended losing streak, it's much higher in American funds. For instance, the film opened in first place in France with 5.7 million Euros, down 16% from its predecessor, however, that's $7.5 million in American funds, a increase of 28%. Other highlights include $5.3 million in Germany, $3.5 million in Spain, $2.2 million in Italy and $1.4 million in both Holland and Switzerland and just shy of $1 million in Sweden. The film remained in first place in Australia despite dropping 50% at the box office to just $1.8 million.
More...
December 20th, 2004
This weekend was the first year anniversary of the last of the Lord of the Rings movies, and the box office really missed its impact. The weekend was almost exactly flat with last weekend, but down 24.6% from last year. However, if you discount the top movie for each, Lemony Snicket's A Series of Unfortunate Events this year and Return of the King for last year, then 2004 is up by more than 11%. The year-to-date comparisons have 2004 up by a mere 1.4% at $8.66 billion.
More...
December 17th, 2004
The look for this weekend is much different than it was at the beginning of the month as a few films had their release dates shuffled. That won't change what film will take first place, but the rest of the top five might be affected.
More...
December 16th, 2004
During the past week promotional websites for several movies were launched and some older ones added additional content. Here the list of this week's releases, a couple of new sites and few updates, including this week's winner
Lemony Snicket's A Series of Unfortunate Events -
Official Site and all subsidiaries. If you know of any new movie websites not on this list feel free to
e-mail me with the details.
More...
December 2nd, 2004
During the past week promotional websites for several movies were launched and some older ones added additional content. Here the list of this week's releases, a couple of new sites and few updates, including this week's winner
Ocean's Twelve -
Official Site. If you know of any new movie websites not on this list feel free to
e-mail me with the details.
More...
December 1st, 2004
December is a huge month at the box office, but also a very unique one. Massive blockbusters are released side by side with smaller films with only Oscar on their minds.
More...
November 24th, 2004
During the past week promotional websites for several movies were launched and some older ones added additional content. Here the list of this week's releases, a couple of new sites and few updates, including this week's winner
Christmas with the Kranks -
Official Site. If you know of any new movie websites not on this list feel free to
e-mail me with the details.
More...
November 18th, 2004
During the past week promotional websites for several movies were launched and some older ones added additional content. Here the list of this week's releases, a couple of new sites and few updates, including this week's winner
Electra -
Official Site . If you know of any new movie websites not on this list feel free to
e-mail me with the details.
More...
November 4th, 2004
During the past week promotional websites for several movies were launched and some older ones added additional content. Here the list of this week's releases, a couple of new sites and few updates, including this week's winner
Bridget Jones: The Edge of Reason -
Official Site. If you know of any new movie websites not on this list feel free to
e-mail me with the details.
More...
October 28th, 2004
During the past week promotional websites for several movies were launched and some older ones added additional content. Here the list of this week's releases, a couple of new sites and few updates, including this week's winner Kung Fu Hustle -
Official Site. If you know of any new movie websites not on this list feel free to
e-mail me with the details.
More...
October 14th, 2004
During the past week promotional websites for several movies were launched and some older ones added additional content. Here the list of this week's releases, a couple of new sites and few updates, including this week's winner
A Very Long Engagement -
Official Site . If you know of any new movie websites not on this list feel free to
e-mail me with the details.
More...
September 30th, 2004
During the past week promotional websites for several movies were launched and some older ones added additional content. Here the list of this week's releases, a couple of new sites and few updates, including this week's winner
Shark Tale -
Official Site. If you know of any new movie websites not on this list feel free to
e-mail me with the details.
More...
August 26th, 2004
During the past week promotional websites for several movies were launched and some older ones added additional content. Here the list of this week's releases, a couple of new sites and few updates including the winner for the week,
Lemony Snicket's A Series of Unfortunate Events -
Official Site, which won also for
CountOlaf.com. If you know of any new movie websites not on this list feel free to
e-mail me with the details.
More...
June 10th, 2004
During the past week promotional websites for several movies were launched and some older ones added additional content. Here the list of this week's releases, a couple of new sites and few updates including the winner for the week,
Garfield -
Official Site. If you know of any new movie websites not on this list feel free to e-mail me with the details.
More...
May 27th, 2004
During the past week promotional websites for several movies were launched and some older ones added additional content. Here the list of this week's releases, a couple of new sites and few updates including the winner for the week,
Baadasssss! -
Official Site. If you know of any new movie websites not on this list feel free to e-mail me with the details.
More...
April 15th, 2004
During the past week promotional websites for several movies were launched and some older ones added additional content. Here the list of this week's releases, a couple of new sites and few updates including the winner for the week,
The Punisher -
Official Site. If you know of any new movie websites not on this list feel free to e-mail me with the details.
More...