April 14th, 2009
Not a busy week on the home market with the least number of new releases on this week for a number of weeks. (It seems busier than it is, because of all of the spotlight reviews. In fact, there are as many spotlight reviews as there are simple mentions. Additionally, there are more spotlight reviews for late arrivals than there are for this week's releases.) Looking for the best of the best, there's not a lot on top worth of the DVD Pick of the Week. The release I'm looking forward to the most is Lost in Austen - Buy from Amazon, which I'm awarding the DVD Pick of the Week. Thanks to the number of spotlight reviews, this week's list had to be split into two with the second part found here.
More...
April 8th, 2009
There were only two or three new releases to reach the top 30 on the rental charts this week, with Quantum of Solace grabbing top spot with nearly 50% more rentals than second place Twilight.
More...
March 31st, 2009
Only two new release charted this week leaving Role Models in first place with 13% more revenue than second place Twilight.
More...
March 24th, 2009
It was a huge week for new releases with nine of them reach the top 30, including four of the top five. The new number one film was Pinocchio, which sold 1.40 million units and generated $23.78 million in consumer spending at retail.
More...
March 24th, 2009
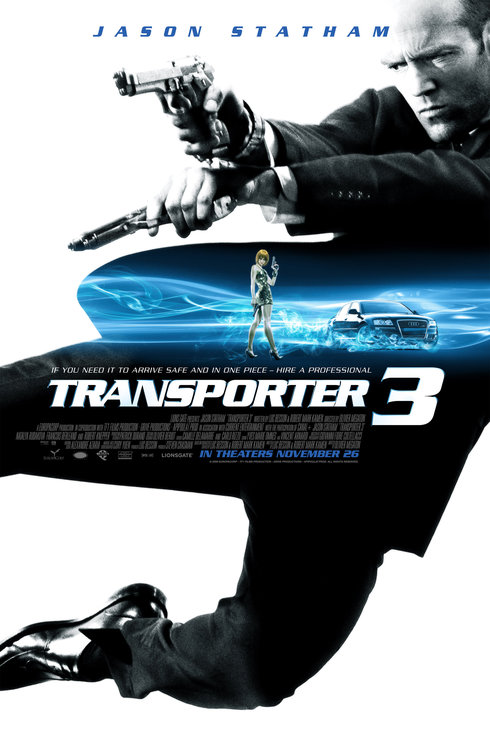
Role Models led the massive collection of new releases on the rental chart with roughly 25% more rentals than Transporter 3.
More...
March 10th, 2009
First run releases let us down again, as the best they can offer is a couple of midlevel hits. There are a few more in the limited release category, including some Awards Season players. However, from that list the best is Let the Right One In on Blu-ray. The best release overall, and the winner of the DVD Pick of the Week is Pinocchio on Blu-ray.
More...
March 1st, 2009
Confessions Of A Shopaholic expanded this past weekend jumping into sixth place with $6.13 million on 1365 screens in 10 markets for a total of $10.05 million. This includes a second place, $2.80 million opening on 424 screens over the weekend in the U.K., for a total of $4.14 million there. The film also held well in Russia down just 42% with $1.04 million on 415 screens over the weekend for a total of $3.41 million after two.
More...
February 22nd, 2009
Recep Ivedik opened in its native Turkey and a few other markets scoring sixth place with $8.32 million on 483 screens in 4 markets. Of that total, $6.10 million was earned on 390 screens during a first place opening in its native market, which is above the pace of its predecessor. The film managed fourth place in Germany with $1.75 million on just 75 screens. An excellent start for the film.
More...
February 15th, 2009
Bride Wars continues its bridesmaid run just missing the top five this week after just missing the top ten last week. It did ad $5.88 million on 2485 screens in 30 markets for a total of $32.11 million after a month of release. Openings this week include Germany, where the film placed second with $1.62 million on 455 screens, which is a mixed debut.
More...
February 8th, 2009
Slumdog Millionaire slipped to sixth place with $7.67 million on 1275 screens in 12 markets for a total of $42.46 million. The film had no major openings this past weekend, but it added $3.02 million on 416 screens during its fourth weekend on top of the charts in the U.K. for a total of $18.21 million in that one market.
More...
February 2nd, 2009
The Very Best Film 2, the sequel to The Very Best Film opened in Russia and a handful of other markets this past weekend. It scored first place in its native land with $8.38 million on 948 screens, while it earned sixth place in total with $9.29 million on 1072 screens in 4 markets. This is a serious decline from its predecessor's opening weekend, but still a strong start otherwise.
More...
January 25th, 2009
Madagascar: Escape 2 Africa fell from second to sixth with $9.07 million on 5601 screens in 48 markets for a total of $380.42 million. No openings hurt the film this past weekend, and its only $1 million markets this past weekend were South Korea at $1.20 million on 432 screens and Poland at $1.09 million on 130. The film has made $3.76 million after two weeks in the former and $7.72 million after three weeks in the latter.
More...
January 18th, 2009
Australia reached a major milestone this past weekend as it topped $100 million internationally. Over the weekend the film added $12.33 million on 4901 screens in 55 markets for a total of $103.30 million internationally and $151.06 million worldwide. Additionally, with openings in Italy, Brazil, China, Russia, and Japan still ahead, the film has a shot at $200 million worldwide. That would be enough to cover the film's production budget, after taking into account Australia's generous tax incentives.
More...
December 28th, 2008
It turns out studio estimates were highly accurate, and the only real change from Wednesday's column involves a surprise $10 million film. If You Are The One opened in first place in China and fourth place internationally with $11.68 million on 1010 screens.
More...
December 21st, 2008
No new openings left Bolt out of the top five with $4.94 million on 1916 screens in 11 markets for a total of $28.69 million. Its best market was Russia where it slipped to second place with $1.20 million on 570 screens for a three-week total of $10.73 million, while it added $1.06 million on 412 screens over the weekend in Spain for a total of $3.96 million after two. The film has yet to open in most major markets, and won't until the new year, but when it is done it should surpass its domestic total while aiming for $250 million worldwide.
More...
December 10th, 2008
As expected, Madagascar: Escape 2 Africa earned first place on the international chart.
However, its weekend haul of $50.99 million on 5,009 screens in 33 markets was better than expected, while its total of $126.43 million internationally is close to 40% of the original's final.
Its best market of the week was Germany where it pulled in $11.43 million on 841 screens, while it also performed amazingly in France ($9.54 million on 788 screens) and in the U.K. ($9.48 million on 520). Other first place debuts included Mexico ($4.53 million on 438 screens); Switzerland ($2.51 million on 152); Belgium ($1.69 million on 115); and Austria ($1.57 million on 101).
More...
December 9th, 2008
The results at the box office were mixed over the weekend with a couple of films topping expectations while a few others failed at that task.
Overall, box office receipts were $82 million, which was 50% lower than last weekend; however, it was Thanksgiving long weekend last weekend so a sharp drop-off was expected.
Compared to the same weekend last year, 2008 was better, but by only 0.5%.
Year-to-date, 2008's lead on 2007 is now 0.5% at $8.72 billion to $8.68 billion.
More...
December 3rd, 2008
Quantum of Solace saw its box office sliced nearly in half down to $20.60 million on 8530 screens in 63 markets, however, its running tally grew to $340.61 million after a month of release. It is now the second highest grossing Bond film and the 70th highest grossing film worldwide. The film's best market of the weekend was Germany where it remained in first place with $2.31 million on 801 screens for a total of $35.29 million. Meanwhile in the U.K. it slipped to second place with a still impressive $2.20 million on 500 screens for a total of $72.27 million after a month of release.
More...
December 2nd, 2008
Tryptophan overload wasn't enough to slow do the box office as every film matched or exceeded Thursday's predictions (or came within a rounding error of doing so). This helped the overall box office pull in $164 million over the three-day weekend and an amazing $234 million over five. Over the three-day weekend the box office was down by less than 1% from last weekend, but it was up by just under 2% over last year and nearly 3% over the five day period. (Strangely, it is $10 million behind the record, which was set in 2000. Ticket price inflation alone should have resulted in that record going down by now.) Year-to-date 2008 has now brought in $8.60 billion compared to $8.57 billion over the same period on 2007.
More...
November 30th, 2008
Thanksgiving weekend produced three big winners, according to studio estimates released on Sunday.
At the top, Four Christmases scored an excellent $31.7 million Friday-Sunday and $46.7 million over the five-day weekend, and is the third best Thanksgiving opening ever, just behind Enchanted's opening last year.
Second place, Friday-Sunday, was taken by Bolt, which scored $26.6 million, and, very unusually these days, earned more in its second weekend than it did in its first.
In sixth place, Madagascar: Escape 2 Africa also benefited from the holiday, dropping just 7% from last weekend to earn another $14.5 million.
More...
November 30th, 2008
Only half-a-dozen movie sites on this week's list, which is very slow. However, we had a couple of strong sites with The Secrets' Official Site coming away with the Weekly Website Award and Australia's Official Site coming in a close second.
More...
November 27th, 2008
The Thanksgiving long weekend has started, but none of the new releases look like they have what it takes to capture top spot. Compared to last year, there are not as many new releases this time around, nor are there any that look as strong as Enchanted was. That said, the holdovers look strong enough to compensate for this weakness.
More...
November 1st, 2008
October was weaker than expected with only a few films living up to expectations, and none earning $100 million at the box office. (And only one even came relatively close.) This month, there are three films that should hit $100 million for sure this month, and all three have at least a shot at $200 million. That's good news because 2008 will to close strong to keep its lead over 2007. Top of the list for anticipated films is Quantum of Solace, but there are two kids movies, Bolt and Madagascar: Escape 2 Africa, that are also worth paying attention to. Additionally, Awards season is starting to heat up, so look for limited releases that could earn Oscar Buzz and become breakout hits.
More...
June 15th, 2008
This week's round of new movie release information contains release dates for Transporter 3, Hoodwinked 2, The Green Hornet and more!
More...
February 28th, 2008
This week's round of new casting information contains updates for Driving Lessons, Night at the Museum 2, Shutter Island, and more!
More...
February 26th, 2008
This week another number of upcoming movies, new stars and directors have been added to our archive!
More...