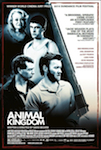

Synopsis
Welcome to the Melbourne underworld, where tensions are building between dangerous criminals and equally dangerous police. The Wild West played out on the city's streets. Armed robber Pope Cody is in hiding, on the run from a gang of renegade detectives who want him dead. His business partner and best friend, Barry 'Baz' Brown, wants out of the game, recognizing that their days of old-school banditry are all but over. Pope's younger brother, the speed-addicted and volatile Craig Cody, is making a fortune in the illicit substances trade - the true cash cow of the modern criminal fraternity - while the youngest Cody brother, Darren, naively navigates his way through this criminal world - the only world his family has ever known. And into this world arrives their nephew, Joshua 'J' Cody. Following the death of his mother, J finds himself living with his estranged family, under the watchful eye of his doting grandmother, Smurf, mother to the Cody boys. J quickly comes to believe that he is a player in this world. But, as he soon discovers, this world is far larger and more menacing than he could ever imagine. When tensions between family and police reach a bloody peak, J finds himself at the center of a cold-blooded revenge plot that turns the family upside down, and which also threatens to ensnare innocent bystanders such as his girlfriend, Nicky. One senior cop, Nathan Leckie, must lure J into the police fold and then shepherd him through a complex minefield of witness protection, corrupt cops, slippery lawyers and a paranoid and vengeful underworld. J comes to realize that in order to survive he must determine how the game is played - he must somehow choose his place in this cunning and brutal animal kingdom. He must work out where he fits.
Metrics
| Opening Weekend: | $61,968 (5.9% of total gross) |
| Legs: | 8.45 (domestic box office/biggest weekend) |
| Domestic Share: | 12.9% (domestic box office/worldwide) |
| Production Budget: | $4,200,000 (worldwide box office is 1.9 times production budget) |
| Theater counts: | 7 opening theaters/61 max. theaters, 7.8 weeks average run per theater |
| Infl. Adj. Dom. BO | $1,426,259 |
Latest Ranking on Cumulative Box Office Lists
| Record | Rank | Amount |
|---|---|---|
| All Time Domestic Box Office (Rank 8,801-8,900) | 8,887 | $1,044,039 |
| All Time International Box Office (Rank 5,601-5,700) | 5,649 | $7,034,644 |
| All Time Worldwide Box Office (Rank 8,301-8,400) | 8,320 | $8,078,683 |
| All Time Domestic Highest Grossing Limited Release Movies (Rank 1,601-1,700) | 1,670 | $1,044,039 |
| All Time Domestic Box Office for R Movies (Rank 3,101-3,200) | 3,187 | $1,044,039 |
| All Time International Box Office for R Movies (Rank 1,401-1,500) | 1,459 | $7,034,644 |
| All Time Worldwide Box Office for R Movies (Rank 2,401-2,500) | 2,438 | $8,078,683 |
See the Box Office tab (Domestic) and International tab (International and Worldwide) for more Cumulative Box Office Records.
Movie Details
| Domestic Releases: | August 13th, 2010 (Limited) by Sony Pictures Classics |
| Video Release: | January 18th, 2011 by Sony Pictures Home Entertainment |
| MPAA Rating: | R for violence, drug content and pervasive language (Rating bulletin 2115 (Cert #46054), 4/7/2010) |
| Running Time: | 112 minutes |
| Comparisons: | vs. Druk Create your own comparison chart… |
| Keywords: | Dysfunctional Family, Organized Crime, Narcotics, Coming of Age, 2010 Sundance Film Festival |
| Source: | Original Screenplay |
| Genre: | Drama |
| Production Method: | Live Action |
| Creative Type: | Contemporary Fiction |
| Production/Financing Companies: | Porchlight Films, Screen Australia, Film Victoria, Screen NSW, Fulcrum Media Finance, Showtime Australia |
| Production Countries: | Australia |
| Languages: | English |