February 18th, 2011
There could be a bit of a race for top spot next weekend, but it is possible that neither new release will be the winner. I'm not sure which new release will have the best shot, but Drive Angry is opening in more theaters and appears to have stronger buzz, or at least louder buzz. Plus one of our prizes this week is a road trip movie, so its the target film for this week's contest. In order to win, one must simply predict the opening weekend box office number for Drive Angry .
Whoever comes the closest to predicting the film's opening 3-day weekend box office (Friday to Sunday), without going over, will win a copy of Thelma and Louise on Blu-ray.
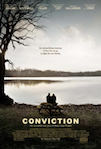
Whoever comes the closest to predicting the film's opening 3-day weekend box office (Friday to Sunday), without going under, will also win a copy of Conviction on Blu-ray.
Entries must be received by 10 a.m., Pacific Time on Friday to be eligible, so don't delay!
More...
February 15th, 2011
Overall, new releases were rather weak, but we did see four films reach the top 30 on the sales chart this week, including a new number one. That film was Beverly Hill Chihuahua 2, which sold 712,000 units, generating $10.67 million in opening week revenue. Granted, this was half as many sales as the original, but that was a theatrical release and this was direct-to-DVD, so I think Disney has to be very happy with this release. In fact, they might be thinking franchise.
More...
February 14th, 2011
It's another really slow week for DVD / Blu-ray releases with a total of one first run release of note. There are a few other smaller releases, as well as catalog titles, etc., The biggest release of the week is also arguably the best, Unstoppable on Blu-ray. And while the release date is bizarre, Doctor Who: A Christmas Carol on Blu-ray is also worth picking up. Also of note is Despicable Me, which came out a couple months ago, but the Blu-ray Combo Pack just arrived last week.
More...
February 12th, 2011
Conviction came out in limited release in the mid-October of this year, which is a great time for an Awards Season contender. It's based on a real life story, which is a subject matter that voters tend to love. It stars Hilary Swank, who has won two Oscars, as well as Minnie Driver and Melissa Leo, both of whom have earned Oscar nominations. I think it's safe to say this film was Oscar bait. It didn't earn any nominations, but does that mean it isn't worth checking out? Or is it merely not award-worthy?
More...
February 1st, 2011
There's still a lull when it comes to first-run releases on the home market with no major, or even midlevel hits coming out this week. In fact, the best-selling release according to Amazon.com is Alice in Wonderland on Blu-ray / DVD Combo Pack, which is a contender for Pick of the Week. The other major contender is Let Me In on Blu-ray, which failed to find an audience despite impressing critics almost as much as the original did. I'm going to give the honor to Let Me In, but both are worthy contenders.
More...
December 17th, 2010
The SAG nominations were handed out this week, and while there were a couple of interesting notes, overall there was a decided lack of surprises. The King's Speech and The Fighter led the way with four nominations each, while Black Swan and The Kids Are All Right were right behind with three. All four have been considered Awards Season players for a long time, so their success with SAG merely confirms that and is not shocking in the least.
More...
November 16th, 2010
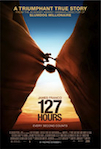
It was a close race for the top of the per theater chart with Tiny Furniture coming out on top with $21,235 in its lone theater. Second place went to 127 Hours with an average of $19,934 in 22 theaters. This bodes well for its chances of expanding.
More...
November 9th, 2010
There were a few limited releases to reach the $10,000 mark on the per theater chart this past weekend. 127 Hours lead the way with an impressive average of $66,213 in four theaters. Fair*Game was well back with $14,154, but it opened in 46 theaters, so this is a much better indicator of its chances to expand. The overall box office leader, MegaMind, was the only other film in the $10,000 club with an average of $11,668, but the second place film, Due Date, came very close with an average of $9,743.
More...
November 2nd, 2010
Again, there was only one film that reached the $10,000 mark on the per theater chart. Inspector Bellamy opened with an average of $10,318 in two theaters. However, Waste Land came very close with $9,806 in its one theater.
More...
October 19th, 2010
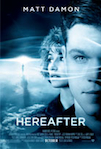
Clint Eastwood's latest film, Hereafter, topped the per theater chart over the weekend with an impressive average of $36,720 in six theaters. It expands wide on Friday, so this fast start was important. The overall box office leader, Jackass 3D, was well back in second place with an average of $16,343, but that's amazing for this type of movie and this time of year. Vision managed $11,406 in its lone theater, while Carlos opened with an average of $10,003 in two theaters, which is literally one ticket away from missing the $10,000 mark.
More...
October 15th, 2010
It looks like we are getting closer and closer to Awards Season with two Oscar potential films coming out this week. At least there are two films that look like they were made to win Oscars. I'm not sure either has what it takes. Other limited releases include two films opening in several hundred theaters, both of which could struggle. There should be at least a couple to find some measure of mainstream success, but I'm unwilling to bet which films those will be.
More...
October 1st, 2010
September is nearly over and the Fall box office season is about to begin in earnest.
September wasn't too bad this year, with more films matching or exceeding expectations than missing them, and we managed to keep pace with last year, more or less.
Can October do the same? Well, last year there was only one $100 million hit, Couples Retreat (not counting Paranormal Activity, which opened in September). We might not see any film hit $100 million this time around.
In fact, we might not even see any that come all that close.
On the other hand, there were also five wide releases that clearly bombed last year, and on that end, 2010 looks a lot better.
Not every film that opens over the next five weekends will be a mid-level hit or better, but most should get there.
More...