Toby Kebbell

Best known as a Supporting Actor based on credits in that role in 16 films, with $2,974,321,287 worldwide aggregate box office (rank #431)
Best-known acting roles: Koba (Dawn of the Planet of the Apes), Jack Chapman (Kong: Skull Island), Koba (War for the Planet of the Apes), Agenor (Wrath of the Titans), Garsiv (Prince of Persia: Sands of Time)
Most productive collaborators: Thomas Tull, Jon Jashni, Duncan Jones, Travis Fimmel, Terry Notary
Born: July 9, 1982 (41 years old)
                                    

  1. Summary
  2. News
  3. Acting Credits
  4. Technical Credits

Career Summary


  MoviesDomestic
Box Office
International
Box Office
Worldwide
Box Office
As an ActorSupporting16$885,143,911$2,089,177,376$2,974,321,287
Leading4$89,785,907$248,706,490$338,492,397
Lead Ensemble Member3$83,797,554$483,934,972$567,732,526
(Unclassified)2$23,111,712$64,861,002$87,972,714
In Technical RolesProducer1$0$0$0

Career Trend

This graph shows Toby Kebbell’s score on our annual analysis of leading stars at the box office. The Star Score represents points assigned to each of the leading stars of the top 100 movies (based on box office) in the current year and two preceding years. For appearing in the number one movie in a year a star gets 100 points, the number two movie 99 points and so on..

Latest Ranking on Selected Box Office Record Lists


2018 Preview: March

March 1st, 2018

Ready Player One

February was an amazing month, thanks mainly to Black Panther, but Fifty Shades Freed and Peter Rabbit were also significant hits and overall the month was a massive improvement over last February. Looking forward, there’s nothing opening in March that will earn as much in total as Black Panther did during its opening weekend. That said, A Wrinkle in Time and Ready Player One should have no trouble getting to $100 million, while Tomb Raider has a 50/50 chance of getting there. Unfortunately, compared to last March, this is still a pittance. There’s a chance that no film opening this March will earn as much in total as Beauty and the Beast opened with last march. We will need Black Panther to have good legs to keep 2018 ahead of 2017 by the end of the month. More...

The Hurricane Heist Trailer

February 1st, 2018

Action movie starring Toby Kebbell and Maggie Grace, opens March 9 ... Full Movie Details. More...

2016 Preview: August

August 1st, 2016

Suicide Squad

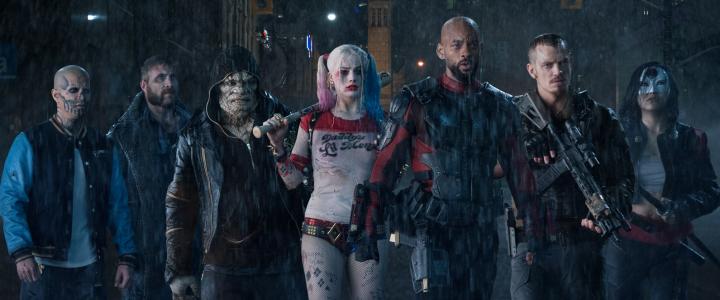
July did reasonably well, thanks mostly to The Secret Life of Pets, which will top $300 million shortly and could earn double its nearest competitor when all is said and done. That said, there were also a quartet of $100 million hits as well, so the month had good depth as well. August isn’t as lucky. There is one film that is expected to earn $100 million during its opening weekend, Suicide Squad, and one more that is expected to reach $100 million in total, Pete’s Dragon. There could be a surprise hit among the rest of the releases, (my long shot with a shot is Sausage Party) but for the most part, the rest of the wide releases would be happy with just $50 million at the box office. Last August was a disaster and Straight Outta Compton was the only hit of the month. Unless Suicide Squad bombs compared to expectations, 2016 will come out ahead in the year-over-year comparison. More...

2016 Preview: June

June 1st, 2016

Finding Dory

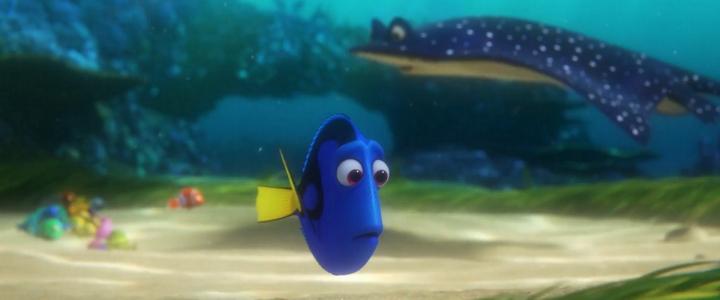
May was great, as long as you don't compare it to last May. Captain America: Civil War was a monster hit and is closing in on $400 million, while both X-Men: Apocalypse and The Angry Birds Movie will earn over $100 million. Looking ahead, every week in June, there is one movie that should top $100 million; however, only Finding Dory is expected to make more than $200 million. In fact, that film is expected to make close to $400 million domestically and over $1 billion worldwide. Last June, there were two monster hits, Inside Out and Jurassic World, plus one $100 million hit, Spy. I don't see how 2016 will top that. Even if every film with a shot at $100 million gets to that milestone, 2016 still might not top last year's pace. Fortunately, 2016 does have a large lead and that could be enough to keep 2016 ahead of 2015's pace in the year-over-year competition. It could be really close at the end of the month, on the other hand. More...

2015 Preview: August

August 1st, 2015

Fantastic Four

It is still a little too soon to tell how July will finish, as we don't have any numbers for the final weekend at the time of writing. We know Minions was a monster hit and that Ant-man will be a financial success. However, until we see how Mission: Impossible - Rogue Nation does, it will be impossible to call the month a true success. If Rogue Nation bombed this weekend, then the month is only a partial success. It would also mean the summer of 2015 could be coming to an abrupt end. As for August, only Fantastic Four has a better than 50/50 chance of reaching $100 million; although some people think Straight Outta Compton also has a shot at that milestone. Besides those two, only a couple of other films even have a realistic shot at becoming midlevel hits. Worse still, last August was amazing with Guardians of the Galaxy breaking records. Teenage Mutant Ninja Turtles also did better than expected with a domestic haul of nearly $200 million. No release this August is going to match that figure. There's a good chance the top two releases combined won't do so. Fortunately, 2015 has a sizable lead over 2014, so even a soft month will keep 2015 ahead in the year-over-year comparison. More...

2014 Preview: July

July 1st, 2014

Dawn of the Planet of the Apes poster

Overall, June was not good. Most films matched expectations, or came close enough that there weren't major disappointments. However, it looks like How to Train Your Dragon 2 will miss expectations by more than $100 million. This was such a massive amount that 2014 lost its lead over 2013 and not even Transformers: Age of Extinction's $100 million opening was able to turn things around. Looking forward to July, there's not a lot of good news. Dawn of the Planet of the Apes might be the only film coming out during July that will reach the $100 million milestone, but on the high end, it might reach the $200 million mark. There are a few others that have a shot, but are not favored to reach the century mark. On the other hand, there are more films that may or may not open / expand wide and even if they do, they will likely have no real impact at the box office. By comparison, last July, Despicable Me 2 was the top draw and finished with more than $350 million. There were also four other films that surpassed $100 million at the box office. It seems practically impossible for 2014 to match those numbers and will likely finish the month behind last year's pace. Overall, 2014 isn't doing poorly, but the summer has been much weaker than the spring was, so we've gone from potential record breaking year to merely average.

More...

All Acting Credits


Register with The Numbers for free to customize this chart.

Release
Date
TitleRoleDomestic
Box Office
International
Box Office
Worldwide
Box Office
May 5, 2020Becoming Alex
Mar 13, 2020Bloodshot Axe $10,021,787$27,141,267$37,163,054
Dec 25, 2018Destroyer Silas $1,533,324$4,332,165$5,865,489
Sep 14, 2018The Angel
Mar 9, 2018The Hurricane Heist Will $6,115,824$27,106,490$33,222,314
Feb 9, 2018The Female Brain $21,786$21,786
Jul 14, 2017War for the Planet of … Koba $146,880,162$342,712,105$489,592,267
Mar 10, 2017Kong: Skull Island Jack Chapman $168,052,812$393,019,247$561,072,059
Jan 27, 2017Gold Jennings $7,227,038$4,951,070$12,178,108
Jan 6, 2017A Monster Calls Dad $3,740,823$42,673,707$46,414,530
Aug 19, 2016Ben-Hur Messala $26,410,477$65,259,171$91,669,648
Aug 5, 2016Buddha’s Little Finger Pyotr
Jun 10, 2016Warcraft Durotan/Antonidas $47,365,290$391,534,534$438,899,824
Aug 7, 2015Fantastic Four Victor von Doom $56,117,548$111,731,639$167,849,187
Jul 11, 2014Dawn of the Planet of … Koba $208,545,589$502,098,977$710,644,566
Oct 25, 2013The Counselor Tony $16,973,715$54,035,619$71,009,334
May 31, 2013The East Doc $2,274,649$753,307$3,027,956
Mar 30, 2012Wrath of the Titans Agenor $83,670,083$221,600,000$305,270,083
Dec 25, 2011War Horse Geordie Soldier $79,883,359$76,932,170$156,815,529
Jul 14, 2010The Sorcerer's Apprentice Drake Stone $63,150,991$154,835,329$217,986,320
May 28, 2010Prince of Persia: Sand… Garsiv $90,759,676$245,600,000$336,359,676
Oct 8, 2008RocknRolla Johnny Quid $5,700,626$22,093,713$27,794,339
May 12, 2006Dead Man's Shoes Anthony $6,408$408,328$414,736
Dec 28, 2005Match Point Policeman $23,089,926$64,861,002$87,950,928
Nov 24, 2004Alexander Pausanius $34,297,191$133,000,000$167,297,191
 
Averages $49,174,504$137,460,945$180,387,224
Totals 25 $1,081,839,084$2,886,679,840$3,968,518,924


Leading or Lead Ensemble Roles


Register with The Numbers for free to customize this chart.

Release
Date
TitleOpening
Weekend
Maximum
Theaters
Domestic
Box Office
Worldwide
Box Office
Domestic
Share
May 5, 2020Becoming
Mar 13, 2020Bloodshot $9,176,6952,861$10,021,787$37,163,05427.0%
Mar 9, 2018The Hurricane Heist $3,024,3992,402$6,115,824$33,222,31418.4%
Aug 19, 2016Ben-Hur $11,203,8153,084$26,410,477$91,669,64828.8%
Aug 5, 2016Buddha’s Little Finger
Jun 10, 2016Warcraft $24,166,1103,406$47,365,290$438,899,82410.8%
Mar 30, 2012Wrath of the Titans $33,457,1883,545$83,670,083$305,270,08327.4%
 
Averages $16,205,6413,060$34,716,692$181,244,98522.5%
Totals 7 $173,583,461$906,224,923


Supporting Roles


Register with The Numbers for free to customize this chart.

Release
Date
TitleOpening
Weekend
Maximum
Theaters
Domestic
Box Office
Worldwide
Box Office
Domestic
Share
Dec 25, 2018Destroyer $55,347235$1,533,324$5,865,48926.1%
Sep 14, 2018The Angel
Jul 14, 2017War for the Planet of … $56,262,9294,100$146,880,162$489,592,26730.0%
Mar 10, 2017Kong: Skull Island $61,025,4723,846$168,052,812$561,072,05930.0%
Jan 27, 2017Gold $3,471,3162,166$7,227,038$12,178,10859.3%
Jan 6, 2017A Monster Calls $30,9091,523$3,740,823$46,414,5308.1%
Aug 7, 2015Fantastic Four $25,685,7374,004$56,117,548$167,849,18733.4%
Jul 11, 2014Dawn of the Planet of … $72,611,4273,969$208,545,589$710,644,56629.3%
Oct 25, 2013The Counselor $7,842,9303,044$16,973,715$71,009,33423.9%
May 31, 2013The East $77,031195$2,274,649$3,027,95675.1%
Dec 25, 2011War Horse $7,515,4022,856$79,883,359$156,815,52950.9%
Jul 14, 2010The Sorcerer's Apprentice $17,619,6223,504$63,150,991$217,986,32029.0%
May 28, 2010Prince of Persia: Sand… $30,095,2593,646$90,759,676$336,359,67627.0%
Oct 8, 2008RocknRolla $144,701836$5,700,626$27,794,33920.5%
May 12, 2006Dead Man's Shoes $1,8252$6,408$414,7361.5%
Nov 24, 2004Alexander $13,687,0872,445$34,297,191$167,297,19120.5%
 
Averages $19,741,8002,425$59,009,594$198,288,08631.0%
Totals 16 $885,143,911$2,974,321,287

Latest Ranking on All Acting Box Office Record Lists


RecordRankAmount
Top 100 Stars in Leading Roles at the Domestic Box Office (Rank 1,101-1,200) 1,104 $173,583,461
Top 100 Stars in Supporting Roles at the Domestic Box Office (Rank 801-900) 810 $885,143,911
Top Live Action Stars at the Domestic Box Office (Rank 701-800) 794 $1,081,817,298
Top Above the Line Stars at the Domestic Box Office (Rank 701-800) 743 $681,951,586
Top Below the Line Stars at the Domestic Box Office (Rank 2,401-2,500) 2,473 $371,068,752
Top Stars at the Domestic Box Office (Rank 1,001-1,100) 1,021 $1,081,839,084
Top 100 Stars in Leading Roles at the International Box Office (Rank 401-500) 459 $732,641,462
Top 100 Stars in Supporting Roles at the International Box Office (Rank 301-400) 356 $2,089,177,376
Top Live Action Stars at the International Box Office (Rank 201-300) 230 $2,886,679,840
Top Above the Line Stars at the International Box Office (Rank 301-400) 303 $1,946,283,596
Top Below the Line Stars at the International Box Office (Rank 1,101-1,200) 1,109 $853,033,201
Top Stars at the International Box Office (Rank 301-400) 342 $2,886,679,840
Top 100 Stars in Leading Roles at the Worldwide Box Office (Rank 501-600) 599 $906,224,923
Top 100 Stars in Supporting Roles at the Worldwide Box Office (Rank 401-500) 431 $2,974,321,287
Top Live Action Stars at the Worldwide Box Office (Rank 301-400) 348 $3,968,497,138
Top Above the Line Stars at the Wordwide Box Office (Rank 401-500) 421 $2,628,235,182
Top Below the Line Stars at the Worldwide Box Office (Rank 1,301-1,400) 1,394 $1,224,101,953
Top Stars at the Worldwide Box Office (Rank 401-500) 496 $3,968,518,924
Highest Grossing Stars of 2012 at the Domestic Box Office (Rank 201-300) 253 64
Highest Grossing Stars of 2013 at the Domestic Box Office (Rank 201-300) 263 64
Highest Grossing Stars of 2014 at the Domestic Box Office (Rank 201-300) 259 64
Highest Grossing Stars of 2016 at the Domestic Box Office (Rank 401-500) 444 35
Highest Grossing Stars of 2017 at the Domestic Box Office (Rank 401-500) 472 35
Highest Grossing Stars of 2018 at the Domestic Box Office (Rank 501-600) 511 35
Highest Grossing Stars of 2020 at the Domestic Box Office (Rank 301-400) 308 69
Highest Grossing Stars of 2021 at the Domestic Box Office (Rank 201-300) 294 69
Highest Grossing Stars of 2022 at the Domestic Box Office (Rank 201-300) 272 69
Highest Grossing Stars of 2012 at the International Box Office (Rank 101-200) 170 77
Highest Grossing Stars of 2013 at the International Box Office (Rank 101-200) 194 77
Highest Grossing Stars of 2014 at the International Box Office (Rank 101-200) 193 77
Highest Grossing Stars of 2016 at the International Box Office 83 101
Highest Grossing Stars of 2017 at the International Box Office 94 101
Highest Grossing Stars of 2018 at the International Box Office (Rank 101-200) 119 101
Highest Grossing Stars of 2012 at the Worldwide Box Office (Rank 101-200) 191 74
Highest Grossing Stars of 2013 at the Worldwide Box Office (Rank 201-300) 213 74
Highest Grossing Stars of 2014 at the Worldwide Box Office (Rank 201-300) 212 74
Highest Grossing Stars of 2016 at the Worldwide Box Office (Rank 101-200) 120 96
Highest Grossing Stars of 2017 at the Worldwide Box Office (Rank 101-200) 135 96
Highest Grossing Stars of 2018 at the Worldwide Box Office (Rank 101-200) 149 96
Top Domestic Leading Stars for Original Screenplay Movies (Rank 2,801-2,900) 2,832 $6,115,824
Top Domestic Leading Stars for Based on Fiction Book/Short Story Movies (Rank 901-1,000) 909 $26,410,477
Top Domestic Leading Stars for Based on Comic/Graphic Novel Movies (Rank 401-500) 428 $10,021,787
Top Domestic Leading Stars for Based on Folk Tale/Legend/Fairytale Movies 37 $83,670,083
Top Domestic Leading Stars for Based on Game Movies 45 $47,365,290
Top International Leading Stars for Original Screenplay Movies (Rank 1,701-1,800) 1,793 $27,106,490
Top International Leading Stars for Based on Fiction Book/Short Story Movies (Rank 501-600) 570 $65,259,171
Top International Leading Stars for Based on Comic/Graphic Novel Movies (Rank 401-500) 409 $27,141,267
Top International Leading Stars for Based on Folk Tale/Legend/Fairytale Movies 31 $221,600,000
Top International Leading Stars for Based on Game Movies 7 $391,534,534
Top Worldwide Leading Stars for Original Screenplay Movies (Rank 2,201-2,300) 2,266 $33,222,314
Top Worldwide Leading Stars for Based on Fiction Book/Short Story Movies (Rank 601-700) 690 $91,669,648
Top Worldwide Leading Stars for Based on Comic/Graphic Novel Movies (Rank 401-500) 428 $37,163,054
Top Worldwide Leading Stars for Based on Folk Tale/Legend/Fairytale Movies 33 $305,270,083
Top Worldwide Leading Stars for Based on Game Movies 14 $438,899,824
Top Domestic Leading Stars for Live Action Movies (Rank 1,201-1,300) 1,293 $89,913,378
Top Domestic Leading Stars for Animation/Live Action Movies (Rank 301-400) 364 $83,670,083
Top International Leading Stars for Live Action Movies (Rank 301-400) 384 $511,041,462
Top International Leading Stars for Animation/Live Action Movies (Rank 301-400) 305 $221,600,000
Top Worldwide Leading Stars for Live Action Movies (Rank 501-600) 553 $600,954,840
Top Worldwide Leading Stars for Animation/Live Action Movies (Rank 301-400) 336 $305,270,083
Top Domestic Leading Stars for Contemporary Fiction Movies (Rank 2,601-2,700) 2,665 $6,115,824
Top Domestic Leading Stars for Historical Fiction Movies (Rank 601-700) 614 $26,410,477
Top Domestic Leading Stars for Super Hero Movies (Rank 301-400) 306 $10,021,787
Top Domestic Leading Stars for Fantasy Movies (Rank 101-200) 150 $131,035,373
Top International Leading Stars for Contemporary Fiction Movies (Rank 1,501-1,600) 1,535 $27,106,490
Top International Leading Stars for Historical Fiction Movies (Rank 301-400) 376 $65,259,171
Top International Leading Stars for Super Hero Movies (Rank 201-300) 279 $27,141,267
Top International Leading Stars for Fantasy Movies 60 $613,134,534
Top Worldwide Leading Stars for Contemporary Fiction Movies (Rank 2,001-2,100) 2,082 $33,222,314
Top Worldwide Leading Stars for Historical Fiction Movies (Rank 401-500) 442 $91,669,648
Top Worldwide Leading Stars for Super Hero Movies (Rank 201-300) 292 $37,163,054
Top Worldwide Leading Stars for Fantasy Movies 80 $744,169,907
Top Domestic Leading Stars for Adventure Movies (Rank 501-600) 581 $110,080,560
Top Domestic Leading Stars for Action Movies (Rank 501-600) 549 $57,387,077
Top Domestic Leading Stars for Thriller/Suspense Movies (Rank 601-700) 643 $6,115,824
Top International Leading Stars for Adventure Movies (Rank 301-400) 395 $286,859,171
Top International Leading Stars for Action Movies (Rank 201-300) 267 $418,675,801
Top International Leading Stars for Thriller/Suspense Movies (Rank 301-400) 379 $27,106,490
Top Worldwide Leading Stars for Adventure Movies (Rank 401-500) 468 $396,939,731
Top Worldwide Leading Stars for Action Movies (Rank 301-400) 327 $476,062,878
Top Worldwide Leading Stars for Thriller/Suspense Movies (Rank 401-500) 492 $33,222,314
Top Domestic Leading Stars for PG-13 Movies (Rank 501-600) 578 $173,583,461
Top International Leading Stars for PG-13 Movies (Rank 201-300) 250 $732,641,462
Top Worldwide Leading Stars for PG-13 Movies (Rank 301-400) 333 $906,224,923
Top Domestic Leading Stars for Warner Bros. Movies (Rank 401-500) 473 $83,670,083
Top Domestic Leading Stars for Universal Movies (Rank 501-600) 532 $47,365,290
Top Domestic Leading Stars for Sony Pictures Movies (Rank 701-800) 793 $10,021,787
Top Domestic Leading Stars for Paramount Pictures Movies (Rank 601-700) 608 $26,410,477
Top International Leading Stars for Warner Bros. Movies (Rank 201-300) 259 $221,600,000
Top International Leading Stars for Universal Movies 98 $391,534,534
Top International Leading Stars for Sony Pictures Movies (Rank 401-500) 481 $27,141,267
Top International Leading Stars for Paramount Pictures Movies (Rank 301-400) 334 $65,259,171
Top Worldwide Leading Stars for Warner Bros. Movies (Rank 301-400) 311 $305,270,083
Top Worldwide Leading Stars for Universal Movies (Rank 101-200) 152 $438,899,824
Top Worldwide Leading Stars for Sony Pictures Movies (Rank 601-700) 650 $37,163,054
Top Worldwide Leading Stars for Paramount Pictures Movies (Rank 401-500) 460 $91,669,648

All Technical Credits


Register with The Numbers for free to customize this chart.

Release
Date
TitleRoleDomestic
Box Office
International
Box Office
Worldwide
Box Office
May 5, 2020Becoming Producer
 
Averages n/an/an/a
Totals 1 n/an/an/a