En kongelig affære (2012)
| Theatrical Performance | ||
| Domestic Box Office | $1,546,761 | Details |
| International Box Office | $17,436,516 | |
| Worldwide Box Office | $18,983,277 | |
| OpusData ID: 179140100 More info... | ||
| Further financial details... | ||
Synopsis
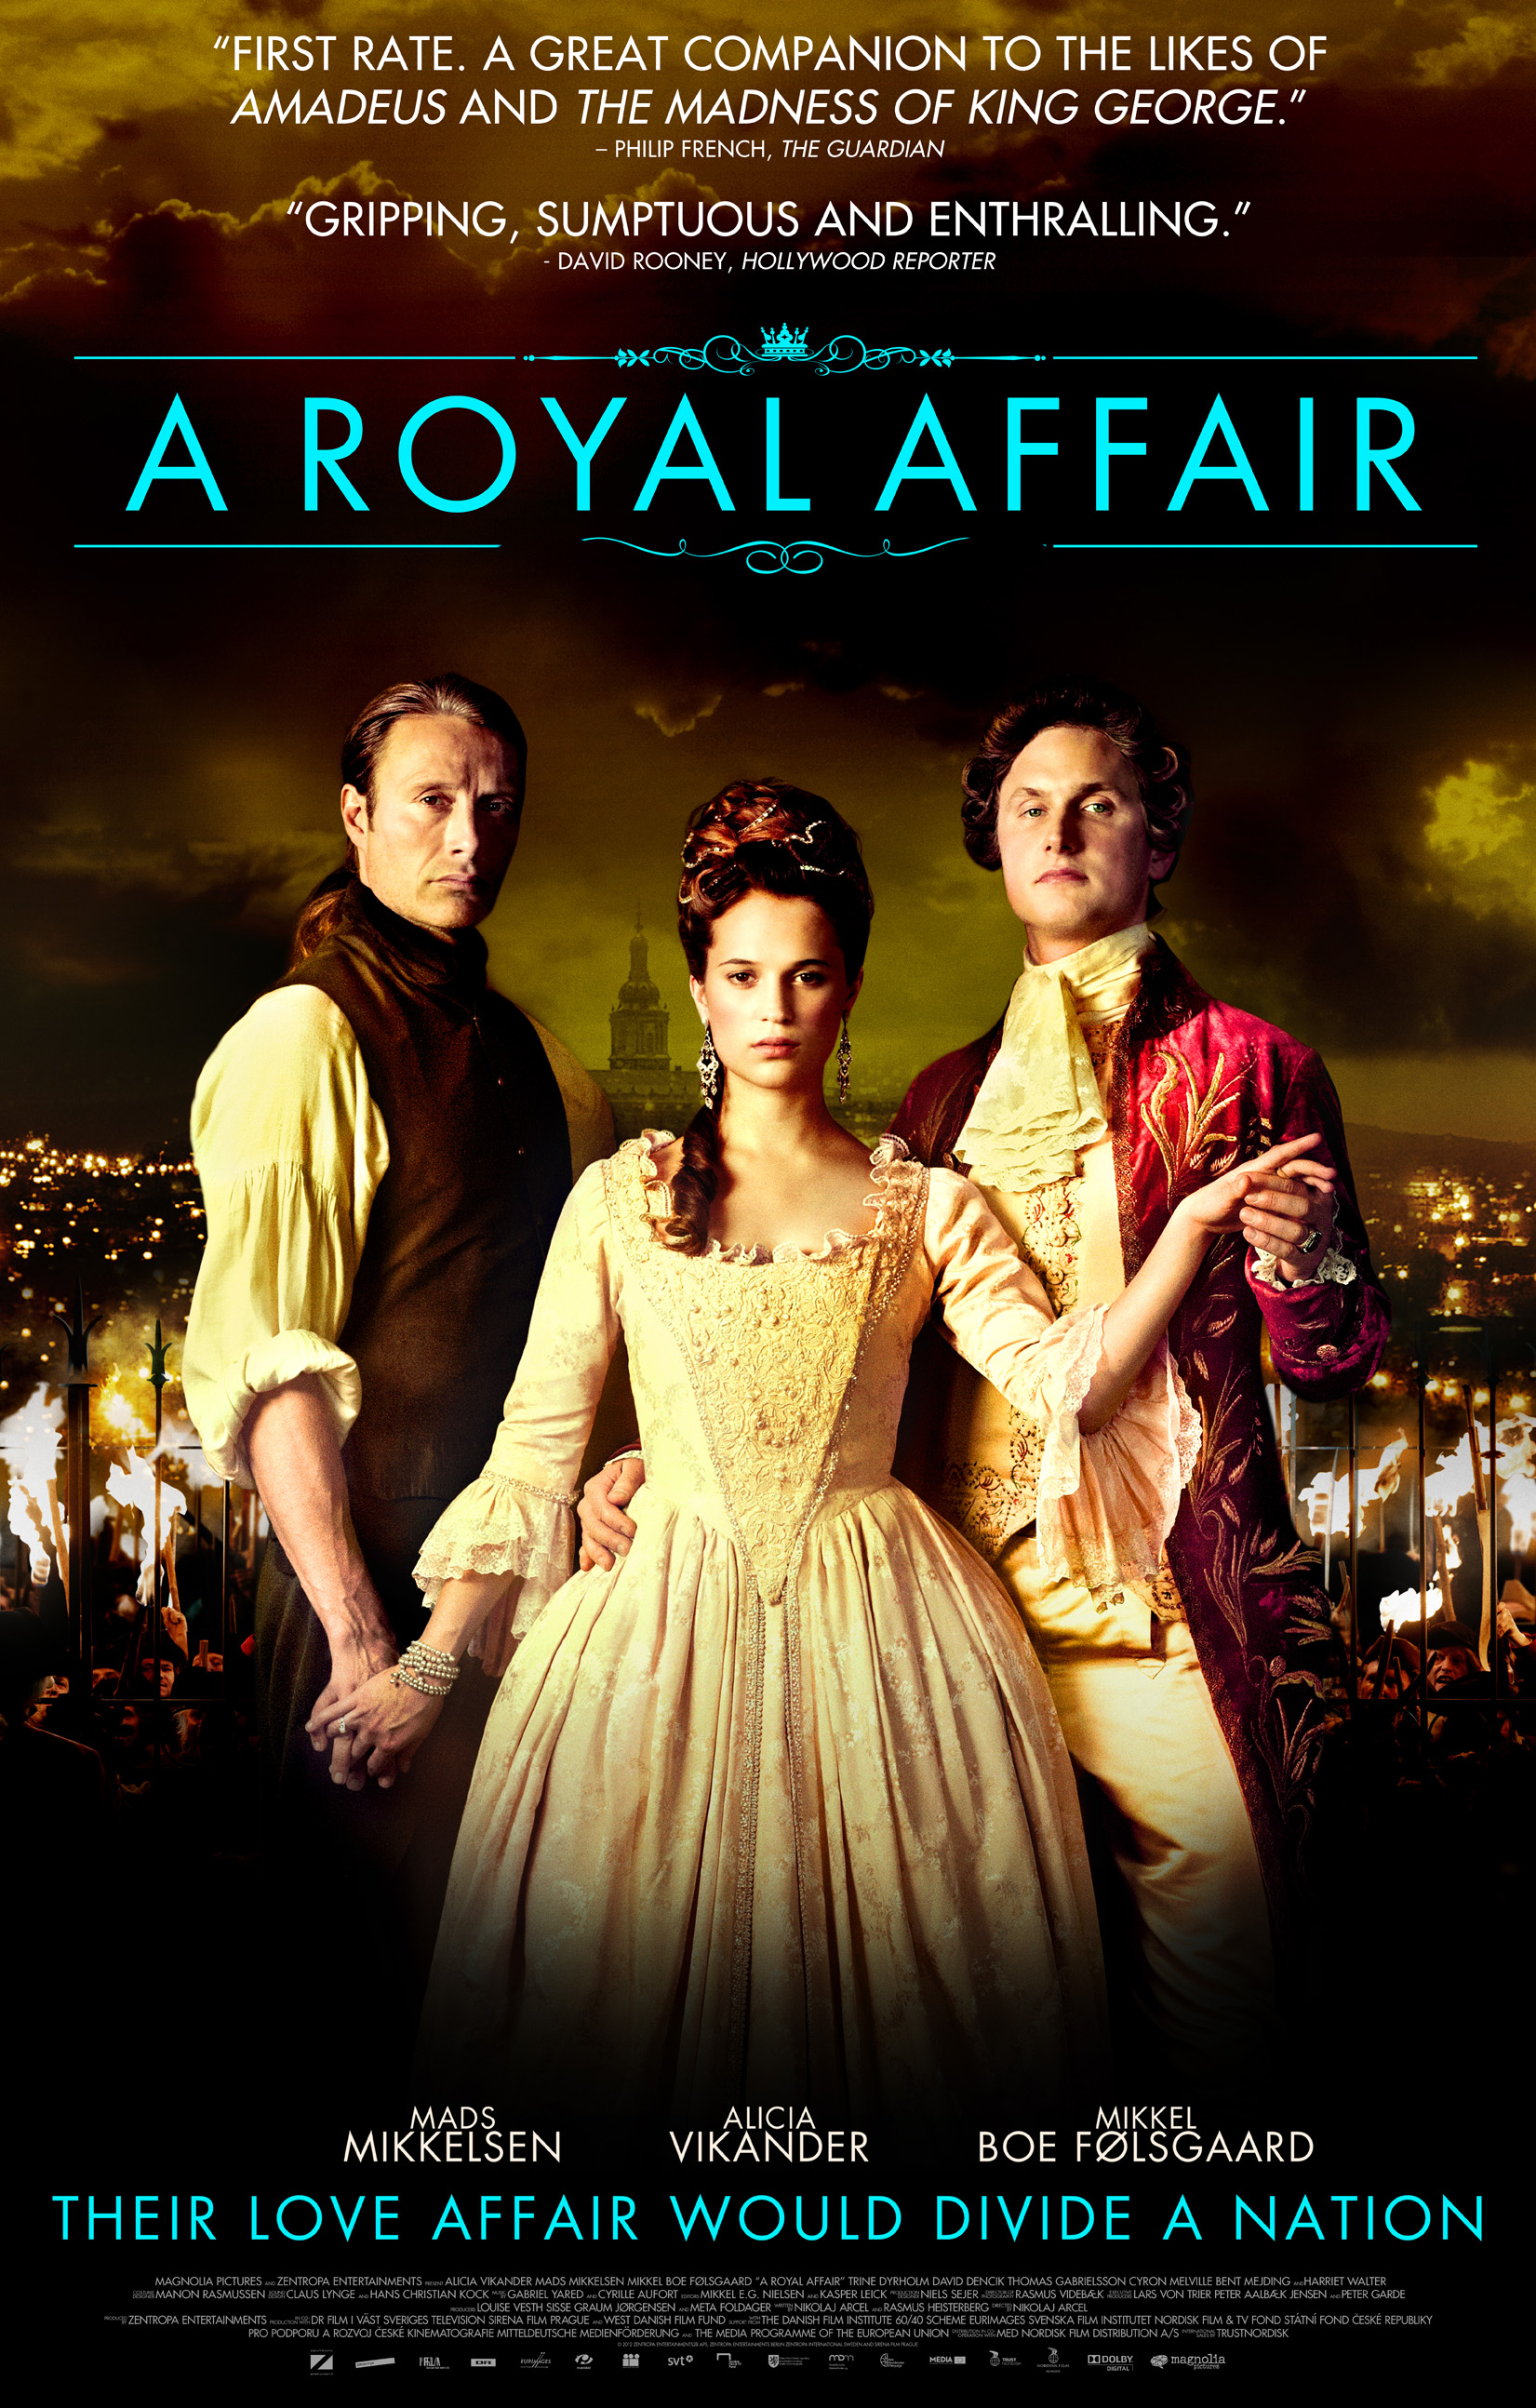
The true story of an ordinary man who wins the queen’s heart and starts a revolution. Centering on the intriguing love triangle between the ever more insane Danish King Christian VII, the royal physician who is a man of enlightenment and idealism, Johann Friedrich Struensee, and the young but strong Queen Caroline Mathilda, A Royal Affair is the tale of brave idealists who risk everything in their pursuit of freedom for their people…
Metrics
| Opening Weekend: | $38,212 (2.5% of total gross) |
| Legs: | 15.99 (domestic box office/biggest weekend) |
| Domestic Share: | 8.1% (domestic box office/worldwide) |
| Theater counts: | 7 opening theaters/56 max. theaters, 11.8 weeks average run per theater |
| Infl. Adj. Dom. BO | $2,295,052 |
Movie Details
| Domestic Releases: | November 9th, 2012 (Limited) by Magnolia Pictures, released as A Royal Affair |
| Video Release: | March 26th, 2013 by Magnolia Home Entertainment, released as A Royal Affair |
| MPA Rating: | R for sexual content and some violent images. (Rating bulletin 2233, 7/25/2012) |
| Running Time: | 137 minutes |
| Cast, crew, or production detail: | Voiceover/Narration |
| Plot point: | Arranged Marriage, Infidelity, Mental Illness, Political, Relationships Gone Wrong, Romance, Royalty, Sex Crimes |
| Social setting: | Epidemic, Revolution |
| Subgenre: | Historical Drama |
| Source: | Based on Real Life Events |
| Genre: | Drama |
| Production Method: | Live Action |
| Creative Type: | Historical Fiction |
| Production/Financing Companies: | Zentropa Entertainments |
| Production Countries: | Denmark, Czech Republic, Sweden, Germany |
| Languages: | Danish, English |
Weekend Box Office Performance
| Date | Rank | Gross | % Change | Theaters | Per Theater | Total Gross | Week |
|---|---|---|---|---|---|---|---|
| Nov 9, 2012 | 46 | $38,212 | 7 | $5,459 | $38,212 | 1 | |
| Nov 16, 2012 | 34 | $78,284 | +105% | 32 | $2,446 | $138,125 | 2 |
| Nov 23, 2012 | 33 | $91,278 | +17% | 44 | $2,075 | $271,131 | 3 |
| Nov 30, 2012 | 34 | $57,591 | -37% | 41 | $1,405 | $373,000 | 4 |
| Dec 7, 2012 | 39 | $53,889 | -6% | 43 | $1,253 | $459,087 | 5 |
| Dec 14, 2012 | 40 | $46,514 | -14% | 56 | $831 | $534,267 | 6 |
| Dec 21, 2012 | 44 | $26,774 | -42% | 36 | $744 | $585,872 | 7 |
| Dec 28, 2012 | 46 | $21,014 | -22% | 32 | $657 | $624,512 | 8 |
| Jan 4, 2013 | 57 | $13,847 | -34% | 22 | $629 | $659,348 | 9 |
| Jan 11, 2013 | 58 | $12,606 | -9% | 29 | $435 | $684,877 | 10 |
| Jan 18, 2013 | 43 | $49,334 | +291% | 38 | $1,298 | $751,595 | 11 |
| Jan 25, 2013 | 40 | $73,035 | +48% | 40 | $1,826 | $853,941 | 12 |
| Feb 1, 2013 | 39 | $96,708 | +32% | 44 | $2,198 | $1,000,814 | 13 |
| Feb 8, 2013 | 43 | $63,642 | -34% | 37 | $1,720 | $1,110,198 | 14 |
| Feb 15, 2013 | 42 | $70,509 | +11% | 34 | $2,074 | $1,244,873 | 15 |
| Feb 22, 2013 | 48 | $36,732 | -48% | 25 | $1,469 | $1,331,193 | 16 |
| Mar 1, 2013 | 58 | $27,047 | -26% | 19 | $1,424 | $1,376,063 | 17 |
| Mar 8, 2013 | 61 | $19,984 | -26% | 13 | $1,537 | $1,410,426 | 18 |
| Mar 15, 2013 | 59 | $23,001 | +15% | 19 | $1,211 | $1,444,407 | 19 |
| Mar 22, 2013 | 69 | $12,619 | -45% | 12 | $1,052 | $1,471,829 | 20 |
| Mar 29, 2013 | 74 | $10,785 | -15% | 7 | $1,541 | $1,494,593 | 21 |
| Apr 5, 2013 | 66 | $15,706 | +46% | 11 | $1,428 | $1,516,403 | 22 |
| Apr 12, 2013 | 79 | $6,519 | -58% | 6 | $1,087 | $1,530,262 | 23 |
| Apr 19, 2013 | 76 | $6,378 | -2% | 6 | $1,063 | $1,540,598 | 24 |
| Apr 26, 2013 | 95 | $1,733 | -73% | 5 | $347 | $1,545,726 | 25 |
Weekly Box Office Performance
| Date | Rank | Gross | % Change | Theaters | Per Theater | Total Gross | Week |
|---|---|---|---|---|---|---|---|
| Nov 9, 2012 | 44 | $59,841 | 7 | $8,549 | $59,841 | 1 | |
| Nov 16, 2012 | 40 | $120,012 | +101% | 32 | $3,750 | $179,853 | 2 |
| Nov 23, 2012 | 29 | $135,556 | +13% | 44 | $3,081 | $315,409 | 3 |
| Nov 30, 2012 | 30 | $89,789 | -34% | 41 | $2,190 | $405,198 | 4 |
| Dec 7, 2012 | 35 | $82,555 | -8% | 43 | $1,920 | $487,753 | 5 |
| Dec 14, 2012 | 42 | $71,345 | -14% | 56 | $1,274 | $559,098 | 6 |
| Dec 21, 2012 | 46 | $44,400 | -38% | 36 | $1,233 | $603,498 | 7 |
| Dec 28, 2012 | 47 | $42,003 | -5% | 32 | $1,313 | $645,501 | 8 |
| Jan 4, 2013 | 55 | $26,770 | -36% | 22 | $1,217 | $672,271 | 9 |
| Jan 11, 2013 | 47 | $29,990 | +12% | 29 | $1,034 | $702,261 | 10 |
| Jan 18, 2013 | 42 | $78,645 | +162% | 38 | $2,070 | $780,906 | 11 |
| Jan 25, 2013 | 40 | $123,200 | +57% | 40 | $3,080 | $904,106 | 12 |
| Feb 1, 2013 | 39 | $142,450 | +16% | 40 | $3,561 | $1,046,556 | 13 |
| Feb 8, 2013 | 42 | $127,808 | -10% | 37 | $3,454 | $1,174,364 | 14 |
| Feb 15, 2013 | 39 | $120,097 | -6% | 34 | $3,532 | $1,294,461 | 15 |
| Feb 22, 2013 | 50 | $54,555 | -55% | 25 | $2,182 | $1,349,016 | 16 |
| Mar 1, 2013 | 62 | $41,426 | -24% | 19 | $2,180 | $1,390,442 | 17 |
| Mar 8, 2013 | 60 | $30,964 | -25% | 13 | $2,382 | $1,421,406 | 18 |
| Mar 15, 2013 | 60 | $37,804 | +22% | 19 | $1,990 | $1,459,210 | 19 |
| Mar 22, 2013 | 66 | $24,598 | -35% | 12 | $2,050 | $1,483,808 | 20 |
| Mar 29, 2013 | 73 | $16,889 | -31% | 7 | $2,413 | $1,500,697 | 21 |
| Apr 5, 2013 | 66 | $23,046 | +36% | 11 | $2,095 | $1,523,743 | 22 |
| Apr 12, 2013 | 79 | $10,477 | -55% | 6 | $1,746 | $1,534,220 | 23 |
| Apr 19, 2013 | 77 | $9,773 | -7% | 6 | $1,629 | $1,543,993 | 24 |
| Apr 26, 2013 | 96 | $2,768 | -72% | 5 | $554 | $1,546,761 | 25 |
Leading
| Mads Mikkelsen | Johann Friedrich Struensee | |
| Alicia Vikander | Queen Caroline Mathilda | |
| Mikkel Boe Folsgaard | King Christian VII |
Supporting
| Trine Dyrholm | Juliana Marie | |
| David Dencik | Guldberg |
Production and Technical Credits
| Nikolaj Arcel | Director | |
| Arcel Heisterberg | Screenwriter | |
| Rasmus Heisterberg | Screenwriter | |
| Louise Vesth | Producer | |
| Sisse Graum Jorgensen | Producer | |
| Meta Foldoger | Producer | |
| Lars Von Trier | Executive Producer | |
| Peter Aalbaek Jensen | Executive Producer | |
| Peter Garde | Executive Producer | |
| Rasmus Videbaek | Director of Photography | |
| Mikkel E.G. Nielsen | Editor | |
| Kasper Leick | Editor | |
| Gabriel Yared | Composer | |
| Cyrille Aufort | Composer | |
| Manon Rasmussen | Costume Designer | |
| Niels Sejer | Production Designer |
Cast and crew with above-the-line roles are marked in bold. The line marks the division between above-the-line and below-the-line roles.
Full financial estimates for this film, including domestic and international box office, video sales, video rentals, TV and ancillary revenue are available through our research services. For more information, please contact us at research@the-numbers.com.
Synopsis
The true story of an ordinary man who wins the queen’s heart and starts a revolution. Centering on the intriguing love triangle between the ever more insane Danish King Christian VII, the royal physician who is a man of enlightenment and idealism, Johann Friedrich Struensee, and the young but strong Queen Caroline Mathilda, A Royal Affair is the tale of brave idealists who risk everything in their pursuit of freedom for their people…
Metrics
| Opening Weekend: | $38,212 (2.5% of total gross) |
| Legs: | 15.99 (domestic box office/biggest weekend) |
| Domestic Share: | 8.1% (domestic box office/worldwide) |
| Theater counts: | 7 opening theaters/56 max. theaters, 11.8 weeks average run per theater |
| Infl. Adj. Dom. BO | $2,295,052 |
Movie Details
| Domestic Releases: | November 9th, 2012 (Limited) by Magnolia Pictures, released as A Royal Affair |
| Video Release: | March 26th, 2013 by Magnolia Home Entertainment, released as A Royal Affair |
| MPA Rating: | R for sexual content and some violent images. (Rating bulletin 2233, 7/25/2012) |
| Running Time: | 137 minutes |
| Cast, crew, or production detail: | Voiceover/Narration |
| Plot point: | Arranged Marriage, Infidelity, Mental Illness, Political, Relationships Gone Wrong, Romance, Royalty, Sex Crimes |
| Social setting: | Epidemic, Revolution |
| Subgenre: | Historical Drama |
| Source: | Based on Real Life Events |
| Genre: | Drama |
| Production Method: | Live Action |
| Creative Type: | Historical Fiction |
| Production/Financing Companies: | Zentropa Entertainments |
| Production Countries: | Denmark, Czech Republic, Sweden, Germany |
| Languages: | Danish, English |
Weekend Box Office Performance
| Date | Rank | Gross | % Change | Theaters | Per Theater | Total Gross | Week |
|---|---|---|---|---|---|---|---|
| Nov 9, 2012 | 46 | $38,212 | 7 | $5,459 | $38,212 | 1 | |
| Nov 16, 2012 | 34 | $78,284 | +105% | 32 | $2,446 | $138,125 | 2 |
| Nov 23, 2012 | 33 | $91,278 | +17% | 44 | $2,075 | $271,131 | 3 |
| Nov 30, 2012 | 34 | $57,591 | -37% | 41 | $1,405 | $373,000 | 4 |
| Dec 7, 2012 | 39 | $53,889 | -6% | 43 | $1,253 | $459,087 | 5 |
| Dec 14, 2012 | 40 | $46,514 | -14% | 56 | $831 | $534,267 | 6 |
| Dec 21, 2012 | 44 | $26,774 | -42% | 36 | $744 | $585,872 | 7 |
| Dec 28, 2012 | 46 | $21,014 | -22% | 32 | $657 | $624,512 | 8 |
| Jan 4, 2013 | 57 | $13,847 | -34% | 22 | $629 | $659,348 | 9 |
| Jan 11, 2013 | 58 | $12,606 | -9% | 29 | $435 | $684,877 | 10 |
| Jan 18, 2013 | 43 | $49,334 | +291% | 38 | $1,298 | $751,595 | 11 |
| Jan 25, 2013 | 40 | $73,035 | +48% | 40 | $1,826 | $853,941 | 12 |
| Feb 1, 2013 | 39 | $96,708 | +32% | 44 | $2,198 | $1,000,814 | 13 |
| Feb 8, 2013 | 43 | $63,642 | -34% | 37 | $1,720 | $1,110,198 | 14 |
| Feb 15, 2013 | 42 | $70,509 | +11% | 34 | $2,074 | $1,244,873 | 15 |
| Feb 22, 2013 | 48 | $36,732 | -48% | 25 | $1,469 | $1,331,193 | 16 |
| Mar 1, 2013 | 58 | $27,047 | -26% | 19 | $1,424 | $1,376,063 | 17 |
| Mar 8, 2013 | 61 | $19,984 | -26% | 13 | $1,537 | $1,410,426 | 18 |
| Mar 15, 2013 | 59 | $23,001 | +15% | 19 | $1,211 | $1,444,407 | 19 |
| Mar 22, 2013 | 69 | $12,619 | -45% | 12 | $1,052 | $1,471,829 | 20 |
| Mar 29, 2013 | 74 | $10,785 | -15% | 7 | $1,541 | $1,494,593 | 21 |
| Apr 5, 2013 | 66 | $15,706 | +46% | 11 | $1,428 | $1,516,403 | 22 |
| Apr 12, 2013 | 79 | $6,519 | -58% | 6 | $1,087 | $1,530,262 | 23 |
| Apr 19, 2013 | 76 | $6,378 | -2% | 6 | $1,063 | $1,540,598 | 24 |
| Apr 26, 2013 | 95 | $1,733 | -73% | 5 | $347 | $1,545,726 | 25 |
Weekly Box Office Performance
| Date | Rank | Gross | % Change | Theaters | Per Theater | Total Gross | Week |
|---|---|---|---|---|---|---|---|
| Nov 9, 2012 | 44 | $59,841 | 7 | $8,549 | $59,841 | 1 | |
| Nov 16, 2012 | 40 | $120,012 | +101% | 32 | $3,750 | $179,853 | 2 |
| Nov 23, 2012 | 29 | $135,556 | +13% | 44 | $3,081 | $315,409 | 3 |
| Nov 30, 2012 | 30 | $89,789 | -34% | 41 | $2,190 | $405,198 | 4 |
| Dec 7, 2012 | 35 | $82,555 | -8% | 43 | $1,920 | $487,753 | 5 |
| Dec 14, 2012 | 42 | $71,345 | -14% | 56 | $1,274 | $559,098 | 6 |
| Dec 21, 2012 | 46 | $44,400 | -38% | 36 | $1,233 | $603,498 | 7 |
| Dec 28, 2012 | 47 | $42,003 | -5% | 32 | $1,313 | $645,501 | 8 |
| Jan 4, 2013 | 55 | $26,770 | -36% | 22 | $1,217 | $672,271 | 9 |
| Jan 11, 2013 | 47 | $29,990 | +12% | 29 | $1,034 | $702,261 | 10 |
| Jan 18, 2013 | 42 | $78,645 | +162% | 38 | $2,070 | $780,906 | 11 |
| Jan 25, 2013 | 40 | $123,200 | +57% | 40 | $3,080 | $904,106 | 12 |
| Feb 1, 2013 | 39 | $142,450 | +16% | 40 | $3,561 | $1,046,556 | 13 |
| Feb 8, 2013 | 42 | $127,808 | -10% | 37 | $3,454 | $1,174,364 | 14 |
| Feb 15, 2013 | 39 | $120,097 | -6% | 34 | $3,532 | $1,294,461 | 15 |
| Feb 22, 2013 | 50 | $54,555 | -55% | 25 | $2,182 | $1,349,016 | 16 |
| Mar 1, 2013 | 62 | $41,426 | -24% | 19 | $2,180 | $1,390,442 | 17 |
| Mar 8, 2013 | 60 | $30,964 | -25% | 13 | $2,382 | $1,421,406 | 18 |
| Mar 15, 2013 | 60 | $37,804 | +22% | 19 | $1,990 | $1,459,210 | 19 |
| Mar 22, 2013 | 66 | $24,598 | -35% | 12 | $2,050 | $1,483,808 | 20 |
| Mar 29, 2013 | 73 | $16,889 | -31% | 7 | $2,413 | $1,500,697 | 21 |
| Apr 5, 2013 | 66 | $23,046 | +36% | 11 | $2,095 | $1,523,743 | 22 |
| Apr 12, 2013 | 79 | $10,477 | -55% | 6 | $1,746 | $1,534,220 | 23 |
| Apr 19, 2013 | 77 | $9,773 | -7% | 6 | $1,629 | $1,543,993 | 24 |
| Apr 26, 2013 | 96 | $2,768 | -72% | 5 | $554 | $1,546,761 | 25 |
Leading
| Mads Mikkelsen | Johann Friedrich Struensee | |
| Alicia Vikander | Queen Caroline Mathilda | |
| Mikkel Boe Folsgaard | King Christian VII |
Supporting
| Trine Dyrholm | Juliana Marie | |
| David Dencik | Guldberg |
Production and Technical Credits
| Nikolaj Arcel | Director | |
| Arcel Heisterberg | Screenwriter | |
| Rasmus Heisterberg | Screenwriter | |
| Louise Vesth | Producer | |
| Sisse Graum Jorgensen | Producer | |
| Meta Foldoger | Producer | |
| Lars Von Trier | Executive Producer | |
| Peter Aalbaek Jensen | Executive Producer | |
| Peter Garde | Executive Producer | |
| Rasmus Videbaek | Director of Photography | |
| Mikkel E.G. Nielsen | Editor | |
| Kasper Leick | Editor | |
| Gabriel Yared | Composer | |
| Cyrille Aufort | Composer | |
| Manon Rasmussen | Costume Designer | |
| Niels Sejer | Production Designer |
Cast and crew with above-the-line roles are marked in bold. The line marks the division between above-the-line and below-the-line roles.
Full financial estimates for this film, including domestic and international box office, video sales, video rentals, TV and ancillary revenue are available through our research services. For more information, please contact us at research@the-numbers.com.