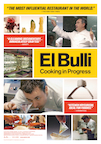

Synopsis
El Bulli, the three-star Michelin restaurant located outside Barcelona in the Catalan province of Girona, has received the S. Pellegrino World’s 50 Best Restaurants Award five times in the last decade, and in 2010 Ferran Adrià was named the Chef of the Decade by the same organization. Adrià is deemed a brilliant innovator, the father of molecular gastronomy, and sometimes a crazy chef. Each year for six months he and his staff sequester themselves to concentrate on creating and testing the new culinary wonders that will become their next 30-course menu.
Metrics
| Opening Weekend: | $12,756 (5.4% of total gross) |
| Legs: | 18.59 (domestic box office/biggest weekend) |
| Domestic Share: | 39.8% (domestic box office/worldwide) |
| Theater counts: | 1 opening theaters/10 max. theaters, 7.6 weeks average run per theater |
| Infl. Adj. Dom. BO | $322,203 |
Latest Ranking on Cumulative Box Office Lists
| Record | Rank | Amount |
|---|---|---|
| All Time Domestic Box Office (Rank 11,201-11,300) | 11,230 | $237,181 |
| All Time International Box Office (Rank 13,701-13,800) | 13,773 | $358,753 |
| All Time Worldwide Box Office (Rank 17,301-17,400) | 17,318 | $595,934 |
| All Time Domestic Highest Grossing Limited Release Movies (Rank 3,401-3,500) | 3,413 | $237,181 |
See the Box Office tab (Domestic) and International tab (International and Worldwide) for more Cumulative Box Office Records.
Movie Details
| Domestic Releases: | July 27th, 2011 (Limited) by Alive Mind |
| Video Release: | March 27th, 2012 by Alive Mind, released as El Bulli: Cooking in Progess |
| MPAA Rating: | Not Rated |
| Running Time: | 108 minutes |
| Comparisons: | Create your own comparison chart… |
| Keywords: | Food, Cinema Verite, Gastronomy |
| Source: | Based on Real Life Events |
| Genre: | Documentary |
| Production Method: | Live Action |
| Creative Type: | Factual |
| Production/Financing Companies: | If...Productions |
| Production Countries: | Germany |
| Languages: | Catalan |