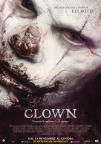
Clown (2015)

Clown poster
Theatrical Performance
Domestic Box Office $55,007Details
International Box Office $2,326,954Details
Worldwide Box Office $2,381,961
Home Market Performance
Est. Domestic DVD Sales $799,638 Details
Est. Domestic Blu-ray Sales $662,443 Details
Total Est. Domestic Video Sales $1,462,081
Further financial details...

Synopsis

When a father finds an old clown suit in his attic, he gives it a spin to brighten up his son’s sixth birthday party.

Metrics

Opening Weekend:$26,920 (48.9% of total gross)
Legs:2.04 (domestic box office/biggest weekend)
Domestic Share:2.3% (domestic box office/worldwide)
Theater counts:100 opening theaters/100 max. theaters, 1.2 weeks average run per theater
Infl. Adj. Dom. BO $68,550

Latest Ranking on Cumulative Box Office Lists


Watch Now On

Amazon VOD:Amazon
iTunes:iTunes
Google Play:Google Play, Google Play
Vudu:Vudu, Vudu

Movie Details

Domestic Releases: June 17th, 2016 (Limited) by Dimension Pictures
International Releases: March 26th, 2015 (Wide) (United Arab Emirates)
May 22nd, 2015 (Wide) (Mexico)
August 6th, 2015 (Wide) (Colombia)
August 13th, 2015 (Wide) (Peru)
August 21st, 2015 (Wide) (Argentina)
... Show all releases
Video Release: June 17th, 2016 by Anchor Bay Home Entertainment
MPAA Rating: R for horror violence and gore, and for language.
(Rating bulletin 2285, 8/14/2013)
Running Time: 100 minutes
Comparisons: vs. Money Monster
Create your own comparison chart…
Keywords: Killer Clowns, Child Murderer, Demons, Curses, Body Horror
Source:Original Screenplay
Genre:Horror
Production Method:Live Action
Creative Type:Contemporary Fiction
Production/Financing Companies: Cross Creek Pictures, Vertebra Films, Dragonfly Entertainment, Eli Roth
Production Countries: United States
Languages: English

Compare this performance with other movies…

Domestic Cumulative Box Office Records

Weekend Box Office Performance

DateRankGross% ChangeTheatersPer TheaterTotal GrossWeek
Jun 17, 2016 38 $26,920   100 $269   $26,920 1
Jun 24, 2016 70 $4,115 -85% 22 $187   $51,809 2

Daily Box Office Performance

DateRankGross%YD%LWTheatersPer TheaterTotal GrossDays
Jun 17, 2016 - $10,196     100 $102   $10,196 1
Jun 18, 2016 - $10,642 +4%   100 $106   $20,838 2
Jun 19, 2016 - $6,082 -43%   100 $61   $26,920 3
Jun 20, 2016 - $4,580 -25%   100 $46   $31,500 4
Jun 21, 2016 - $5,074 +11%   100 $51   $36,574 5
Jun 22, 2016 - $6,509 +28%   100 $65   $43,083 6
Jun 23, 2016 - $4,611 -29%   100 $46   $47,694 7
Jun 24, 2016 - $1,261 -73% -88% 22 $57   $48,955 8
Jun 25, 2016 - $1,672 +33% -84% 22 $76   $50,627 9
Jun 26, 2016 - $1,182 -29% -81% 22 $54   $51,809 10
Jun 27, 2016 - $572 -52% -88% 22 $26   $52,381 11
Jun 28, 2016 - $1,123 +96% -78% 22 $51   $53,504 12
Jun 29, 2016 - $689 -39% -89% 22 $31   $54,193 13
Jun 30, 2016 - $814 +18% -82% 22 $37   $55,007 14

Weekly Box Office Performance

DateRankGross% ChangeTheatersPer TheaterTotal GrossWeek
Jun 17, 2016 38 $47,694   100 $477   $47,694 1
Jun 24, 2016 69 $7,313 -85% 22 $332   $55,007 2

Box Office Summary Per Territory

Territory Release
Date
Opening
Weekend
Opening
Weekend
Screens
Maximum
Screens
Theatrical
Engagements
Total
Box Office
Report
Date
Argentina 8/21/2015 $190,169 88 88 126 $295,554 11/25/2018
Bolivia 8/27/2015 $0 0 6 6 $22,647 12/30/2018
Colombia 8/6/2015 $0 0 4 7 $127,345 12/30/2018
Mexico 5/22/2015 $354,744 0 34 79 $1,712,659 8/30/2018
Peru 8/13/2015 $91,850 49 49 64 $158,476 12/20/2018
United Arab Emirates 3/26/2015 $0 0 4 4 $2,857 12/30/2018
Uruguay 11/12/2015 $0 0 1 1 $7,416 12/30/2018
 
International Total$2,326,954 12/30/2018

International Cumulative Box Office Records


Worldwide Cumulative Box Office Records


Weekly US DVD Sales

DateRankUnits
this
Week
% ChangeTotal
Units
Spending
this
Week
Total
Spending
Weeks
in
Release
Aug 28, 20161420,454 20,454$263,448$263,44811

Weekly US Blu-ray Sales

DateRankUnits
this
Week
% ChangeTotal
Units
Spending
this
Week
Total
Spending
Weeks
in
Release
Aug 28, 2016726,262 26,262$423,608$423,60811

Our DVD and Blu-ray sales estimates are based on weekly retail surveys, which we use to build a weekly market share estimate for each title we are tracking. The market share is converted into a weekly sales estimate based on industry reports on the overall size of the market, including reports published in Media Play News.

For example, if our weekly retail survey estimates that a particular title sold 1% of all units that week, and the industry reports sales of 1,500,000 units in total, we will estimate 15,000 units were sold of that title. The consumer spending estimate is based on the average sales price for the title in the retailers we survey.

We refine our estimates from week to week as more data becomes available. In particular, we adjust weekly sales figures for the quarter once the total market estimates are published by the Digital Entertainment Group. Figures will therefore fluctuate each week, and totals for individual titles can go up or down as we update our estimates.

Because sales figures are estimated based on sampling, they will be more accurate for higher-selling titles.

Full financial estimates for this film, including domestic and international box office, video sales, video rentals, TV and ancillary revenue are available through our research services. For more information, please contact us at research@the-numbers.com.

Leading Cast

Laura Allen    Meg McCoy
Andy Powers    Kent McCoy
Peter Stormare    Herbert Karlsson

Supporting Cast

Elizabeth Whitmere    Denise
Christian Distefano    Jack McCoy
Chuck Shamata    Walt
Robert Reynolds    Dr. Martin Karlsson
Lucas Kelly    Colton
Michael Riendeau    Robbie
Eli Roth    Frowny the Clown

For a description of the different acting role types we use to categorize acting perfomances, see our Glossary.

Production and Technical Credits

Jon Watts    Director
Christopher Ford*    Screenwriter
Jon Watts    Screenwriter
Cody Ryder    Producer
Mac Cappuccino    Producer
Brian Oliver    Producer
Eli Roth    Producer
Andrew Cappuccino    Executive Producer
Helen Cappuccino    Executive Producer
Robert Menzies    Executive Producer
James Holt    Executive Producer
Harvey Weinstein    Executive Producer
Bob Weinstein    Executive Producer
Matthew Santo    Director of Photography
Robert Ryang    Editor
Lisa Soper    Production Designer
Matthew Veligdan    Music By
Joe Rudge    Music Supervisor
Ilona Smyth    Casting By
Billy Hopkins    Casting By

Home Market Releases for August 23rd, 2016

August 24th, 2016

The Nice Guys

There are not many major hits on this week’s list, but there are several releases that are contenders for Pick of the Week. This includes TV on DVD releases like Ash vs The Evil Dead: Season 1 (DVD or Blu-ray), as well as limited releases like Maggie’s Plan (DVD or Blu-ray). However, in the end I went with The Nice Guys on Blu-ray Combo Pack. More...

Theater Averages: Dory Finds Her Way to the Top with $31,373

June 21st, 2016

Finding Dory

Finding Dory not only earned first place on the weekend box office chart, but it also earned first place on the theater average chart with $31,373 per theater. Homeless Billionaire was next with $19,771 in its lone theater. Tickled earned an average of $10,949 in two theaters. Meanwhile, Central Intelligence was right behind with an average of $10,130. More...

Limited and VOD Releases: Limited Releases have Dozens of Uses

June 17th, 2016

Swiss Army Man

There's not a lot of limited releases coming out this week, but there is one that I'm really interested in seeing: Swiss Army Man. Its reviews are not the best, but its premise is certainly intriguing. On the other hand, Raiders! The Story of the Greatest Fan Film Ever Made is a better movie for fans of movies. It is certainly worth at least a VOD rental. More...


  1. Summary
  2. News
  3. Box Office
  4. International
  5. Video Sales
  6. Full Financials
  7. Cast & Crew
  8. Trailer

Synopsis

When a father finds an old clown suit in his attic, he gives it a spin to brighten up his son’s sixth birthday party.

Metrics

Opening Weekend:$26,920 (48.9% of total gross)
Legs:2.04 (domestic box office/biggest weekend)
Domestic Share:2.3% (domestic box office/worldwide)
Theater counts:100 opening theaters/100 max. theaters, 1.2 weeks average run per theater
Infl. Adj. Dom. BO $68,550

Latest Ranking on Cumulative Box Office Lists


Watch Now On

Amazon VOD:Amazon
iTunes:iTunes
Google Play:Google Play, Google Play
Vudu:Vudu, Vudu

Movie Details

Domestic Releases: June 17th, 2016 (Limited) by Dimension Pictures
International Releases: March 26th, 2015 (Wide) (United Arab Emirates)
May 22nd, 2015 (Wide) (Mexico)
August 6th, 2015 (Wide) (Colombia)
August 13th, 2015 (Wide) (Peru)
August 21st, 2015 (Wide) (Argentina)
... Show all releases
Video Release: June 17th, 2016 by Anchor Bay Home Entertainment
MPAA Rating: R for horror violence and gore, and for language.
(Rating bulletin 2285, 8/14/2013)
Running Time: 100 minutes
Comparisons: vs. Money Monster
Create your own comparison chart…
Keywords: Killer Clowns, Child Murderer, Demons, Curses, Body Horror
Source:Original Screenplay
Genre:Horror
Production Method:Live Action
Creative Type:Contemporary Fiction
Production/Financing Companies: Cross Creek Pictures, Vertebra Films, Dragonfly Entertainment, Eli Roth
Production Countries: United States
Languages: English

Leading Cast

Laura Allen    Meg McCoy
Andy Powers    Kent McCoy
Peter Stormare    Herbert Karlsson

Supporting Cast

Elizabeth Whitmere    Denise
Christian Distefano    Jack McCoy
Chuck Shamata    Walt
Robert Reynolds    Dr. Martin Karlsson
Lucas Kelly    Colton
Michael Riendeau    Robbie
Eli Roth    Frowny the Clown

For a description of the different acting role types we use to categorize acting perfomances, see our Glossary.

Production and Technical Credits

Jon Watts    Director
Christopher Ford*    Screenwriter
Jon Watts    Screenwriter
Cody Ryder    Producer
Mac Cappuccino    Producer
Brian Oliver    Producer
Eli Roth    Producer
Andrew Cappuccino    Executive Producer
Helen Cappuccino    Executive Producer
Robert Menzies    Executive Producer
James Holt    Executive Producer
Harvey Weinstein    Executive Producer
Bob Weinstein    Executive Producer
Matthew Santo    Director of Photography
Robert Ryang    Editor
Lisa Soper    Production Designer
Matthew Veligdan    Music By
Joe Rudge    Music Supervisor
Ilona Smyth    Casting By
Billy Hopkins    Casting By

Home Market Releases for August 23rd, 2016

August 24th, 2016

The Nice Guys

There are not many major hits on this week’s list, but there are several releases that are contenders for Pick of the Week. This includes TV on DVD releases like Ash vs The Evil Dead: Season 1 (DVD or Blu-ray), as well as limited releases like Maggie’s Plan (DVD or Blu-ray). However, in the end I went with The Nice Guys on Blu-ray Combo Pack. More...

Theater Averages: Dory Finds Her Way to the Top with $31,373

June 21st, 2016

Finding Dory

Finding Dory not only earned first place on the weekend box office chart, but it also earned first place on the theater average chart with $31,373 per theater. Homeless Billionaire was next with $19,771 in its lone theater. Tickled earned an average of $10,949 in two theaters. Meanwhile, Central Intelligence was right behind with an average of $10,130. More...

Limited and VOD Releases: Limited Releases have Dozens of Uses

June 17th, 2016

Swiss Army Man

There's not a lot of limited releases coming out this week, but there is one that I'm really interested in seeing: Swiss Army Man. Its reviews are not the best, but its premise is certainly intriguing. On the other hand, Raiders! The Story of the Greatest Fan Film Ever Made is a better movie for fans of movies. It is certainly worth at least a VOD rental. More...

Compare this performance with other movies…

Domestic Cumulative Box Office Records

Weekend Box Office Performance

DateRankGross% ChangeTheatersPer TheaterTotal GrossWeek
Jun 17, 2016 38 $26,920   100 $269   $26,920 1
Jun 24, 2016 70 $4,115 -85% 22 $187   $51,809 2

Daily Box Office Performance

DateRankGross%YD%LWTheatersPer TheaterTotal GrossDays
Jun 17, 2016 - $10,196     100 $102   $10,196 1
Jun 18, 2016 - $10,642 +4%   100 $106   $20,838 2
Jun 19, 2016 - $6,082 -43%   100 $61   $26,920 3
Jun 20, 2016 - $4,580 -25%   100 $46   $31,500 4
Jun 21, 2016 - $5,074 +11%   100 $51   $36,574 5
Jun 22, 2016 - $6,509 +28%   100 $65   $43,083 6
Jun 23, 2016 - $4,611 -29%   100 $46   $47,694 7
Jun 24, 2016 - $1,261 -73% -88% 22 $57   $48,955 8
Jun 25, 2016 - $1,672 +33% -84% 22 $76   $50,627 9
Jun 26, 2016 - $1,182 -29% -81% 22 $54   $51,809 10
Jun 27, 2016 - $572 -52% -88% 22 $26   $52,381 11
Jun 28, 2016 - $1,123 +96% -78% 22 $51   $53,504 12
Jun 29, 2016 - $689 -39% -89% 22 $31   $54,193 13
Jun 30, 2016 - $814 +18% -82% 22 $37   $55,007 14

Weekly Box Office Performance

DateRankGross% ChangeTheatersPer TheaterTotal GrossWeek
Jun 17, 2016 38 $47,694   100 $477   $47,694 1
Jun 24, 2016 69 $7,313 -85% 22 $332   $55,007 2

Box Office Summary Per Territory

Territory Release
Date
Opening
Weekend
Opening
Weekend
Screens
Maximum
Screens
Theatrical
Engagements
Total
Box Office
Report
Date
Argentina 8/21/2015 $190,169 88 88 126 $295,554 11/25/2018
Bolivia 8/27/2015 $0 0 6 6 $22,647 12/30/2018
Colombia 8/6/2015 $0 0 4 7 $127,345 12/30/2018
Mexico 5/22/2015 $354,744 0 34 79 $1,712,659 8/30/2018
Peru 8/13/2015 $91,850 49 49 64 $158,476 12/20/2018
United Arab Emirates 3/26/2015 $0 0 4 4 $2,857 12/30/2018
Uruguay 11/12/2015 $0 0 1 1 $7,416 12/30/2018
 
International Total$2,326,954 12/30/2018

International Cumulative Box Office Records


Worldwide Cumulative Box Office Records


Weekly US DVD Sales

DateRankUnits
this
Week
% ChangeTotal
Units
Spending
this
Week
Total
Spending
Weeks
in
Release
Aug 28, 20161420,454 20,454$263,448$263,44811

Weekly US Blu-ray Sales

DateRankUnits
this
Week
% ChangeTotal
Units
Spending
this
Week
Total
Spending
Weeks
in
Release
Aug 28, 2016726,262 26,262$423,608$423,60811

Our DVD and Blu-ray sales estimates are based on weekly retail surveys, which we use to build a weekly market share estimate for each title we are tracking. The market share is converted into a weekly sales estimate based on industry reports on the overall size of the market, including reports published in Media Play News.

For example, if our weekly retail survey estimates that a particular title sold 1% of all units that week, and the industry reports sales of 1,500,000 units in total, we will estimate 15,000 units were sold of that title. The consumer spending estimate is based on the average sales price for the title in the retailers we survey.

We refine our estimates from week to week as more data becomes available. In particular, we adjust weekly sales figures for the quarter once the total market estimates are published by the Digital Entertainment Group. Figures will therefore fluctuate each week, and totals for individual titles can go up or down as we update our estimates.

Because sales figures are estimated based on sampling, they will be more accurate for higher-selling titles.

Full financial estimates for this film, including domestic and international box office, video sales, video rentals, TV and ancillary revenue are available through our research services. For more information, please contact us at research@the-numbers.com.