August 1st, 2012
There were quite a few new releases to reach the Blu-ray sales chart this week, including three in the top five. However, the top two spots were held by holdovers: Batman Begins and The Dark Knight. Batman Begins sold 313,000 units / $3.11 million for the week for approximate total sales of 1.8 million units / $23 million. The Dark Knight sold 280,000 units and generating just under $6.00 million for the week and has now sold 7.3 million units sold and generated $116 million in total revenue. It is very likely the best-selling Blu-ray of all time overtaking Avatar, although Avatar did generate more total revenue. (Unfortunately, it started on Blu-ray while the market was small enough that there's uncertainty with early numbers.)
More...
July 31st, 2012
New releases dominated the DVD sales chart taking three of the top five spots and six of the top eleven. This includes a new number one film, The Three Stooges, which sold 378,000 units while generating $7.55 million in opening week revenue. This is a good start compared to its theatrical run, but not a great start. Additionally, it didn't have a strong theatrical run, so this is more damning it with faint praise.
More...
July 23rd, 2012
I'm getting tired of saying this, but it is a slow week on the home market. There is one prime release, Star Trek: The Next Generation: Season One on Blu-ray, which is currently leading this week's new releases, according to Amazon.com. The second best selling new release is Masterpiece Mystery: Inspector Lewis Series 5 on DVD. It's a good show, but it is a British Import and these rarely make an impact on the chart. Third best selling new release? Game of Thrones. This is the third or fourth time the first season of this TV show has been "released" on the home market. I don't know why they are doing this, but it is getting annoying. There are not a lot of contenders for Pick of the Week either. Jiro Dreams of Sushi on Blu-ray and Star Trek: The Next Generation are the two leading contenders. While ST:TNG became an amazing series, it started out weak, so Jiro Dreams of Sushi is the better choice, but both are easily worth picking up.
More...
July 17th, 2012
It's broken record time. As is usual for this time of year, it is a slow week on the home market. There are two first run releases coming out, Lockout and The Three Stooges, but neither film was a box office hit. On the other hand, there are a number of catalogue titles (Singin' In the Rain); limited releases (Salmon Fishing in the Yemen); and TV on DVD releases (Sanctuary: The Complete Fourth Season). All three of those releases are contenders for Pick of the Week, but in the end I went with Leverage: Season Four.
More...
July 16th, 2012
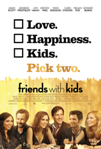
Friends with Kids had a lot of pre-release buzz, especially for a limited release. It was written, directed, and starred Jennifer Westfeldt. It also stars Kristen Wiig, Maya Rudolph, Jon Hamm, and others. It opened in several hundred theaters, but it only did okay business during its opening weekend and its per theater average sunk the second week. Granted, it made more than $7 million during its run, which is a great number for a limited release, but below expectations. Is the film's quality the same? Is it good, but below expectations?
More...
March 27th, 2012
There were only two films in the $10,000 club on the per theater chart, but the number one film was massive. The Hunger Games not only took top spot on the overall chart, but it earned an average of $36,871, which was more than double its nearest competitor. Second place went to The Raid: Redemption with an average of $15,270 in 14 theaters. This suggests some potential for expansion, while it should reach at least one major milestone before its theatrical run is done.
More...
March 21st, 2012
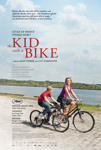
The Kid with a Bike took top spot on the per theater chart with an average of $15,311 in three theaters, while Jiro Dreams of Sushi was in a virtual tie with an average of $15,202 in six. Gerhard Richter Painting was next with $13,537 in its lone theater. The overall box office leader, 21 Jump Street, was next with an average of $11,632, while last week's winner, Footnote, was right behind with $11,181.
More...
March 13th, 2012
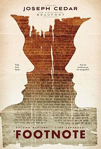
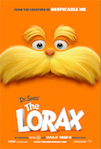
Footnote led the way on the per theater chart with an average of $23,764 in two theaters, while Jiro Dreams of Sushi was right behind with an average of $21,018, also in two theaters. Salmon Fishing in the Yemen was playing in a lot more theaters, but it managed an average of $12,550 in 18 theaters. Even more impressively, it saw growth from Friday to Sunday of 85%, which is amazing for a new release. This bodes very well for its long term potential. Finally, the overall box office leader, Dr. Seuss' The Lorax, rounded out the $10,000 club with an average of $10,370.
More...
March 11th, 2012
Although John Carter's opening won't be as bad as the direst predictions, an anemic $30.6 million debut will condemn the film to the record books for all the wrong reasons and (in spite of good international numbers) almost certainly cause a write-down for Disney. Or more immediate embarrassment, the film will fail to win the weekend, coming in second to The Lorax, which is set to post $39.1 million in its second weekend, according to Universal's estimate. That combination of two $30 million plus films will give 2012 another weekend win over last year.
More...
March 9th, 2012
There are plenty of limited releases on this week's list, including a couple that earned some strong pre-release buzz. One of these, Friends with Kids is opening in close to 400 theaters, which is a huge amount for a limited release. It will certainly be the biggest limited release at the box office, but I'm not sure how well it will do on the per theater chart. There are a few films earning amazing reviews, including Jiro Dreams of Sushi, Footnote, and Sound of Noise. I'm not sure any have what it takes to expand significantly, but hopefully at least one of them will find a receptive audience in limited release.
More...