March 2nd, 2014
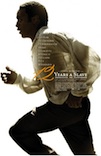
Independent Spirit Award handed out the hardware last night and the big winner was 12 Years a Slave, which picked up five of the seven awards it was nominated for.
More...
November 28th, 2013
Independent Spirit Award started the Awards Season this week, handing out its nominations. 12 Years a Slave led the way with seven nominations, but it wasn't the only film to pick up multiple nominations.
More...
August 7th, 2013
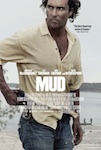
Like it usually is during the summer, this week is rather soft on home market. Granted, there is one wide release that did very well at the box office, Oblivion, plus a couple of limited releases that did well to earn a serious measure of mainstream success, The Place Beyond the Pines and Mud. However, there are also some releases in the top twenty that are definitely filler. Usually, once you reach exercise videos, there's nothing worth talking about. Of course, if I used that rule this week, there would be almost nothing on this week's list. Mud is likely the best release and the DVD or Blu-ray is worth picking up, but I'm still waiting for the screener to review and I hate awarding something Pick of the Week if the screener is late. Because of this, I'm going with another late release, Burn Notice: Season Six, as Pick of the Week. It arrived more than a month late, but it was worth the wait.
More...
June 25th, 2013
You can tell it's summertime, because the two wide releases topped the per theater chart this weekend. Monsters University earned first place on both the overall chart and the per theater average chart with an average of $20,587. World War Z placed second with $18,412. Unfinished Song earned an average of $12,864 in two theaters. The only holdover in the $10,000 club was 20 Feet from Stardom, which earned an average of $10,744 in six theaters.
More...
June 9th, 2013
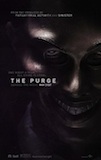
Coming into this weekend, Universal was already celebrating above-expectations performances this year for their releases Fast and Furious 6, Identity Thief and Mama, but those three successes have been eclipsed by a big surprise in the opening weekend for The Purge. The home invasion movie, made for just $3 million, will top the chart this weekend with an estimated $36.4 million, blowing past all expectations, and putting it on par with big budget movies like Oblivion. Doing so from a modest 2,536 theaters (and with a correspondingly low marketing budget) makes the victory even sweeter for the studio, which now boasts a 15% market share for the year. If it keeps going at this pace, Universal will have its best year since we started keeping records in 1995.
More...
May 29th, 2013
As expected, Before Midnight led the way on the per theater chart with an average $49,383. This is the third best per theater average so far this year, behind just The Place Beyond the Pines and Spring Breakers. The overall box office leader, Fast and Furious 6, was next with an average of $26,620. Fill the Void was relatively close behind with an average of $19,721 in three theaters. The final film in the $10,000 club was The Hangover 3 with an average of $11,722.
More...
May 23rd, 2013
Frances Ha earned first place on the per theater chart with an average of $34,350 in four theaters. This is strong enough to suggest serious potential to expand. The overall number one film, Star Trek into Darkness, placed second with an average of $18,140. That's a fantastic start, but lower than expected.
More...
May 16th, 2013
The second big summer release comes out this week, Star Trek into Darkness. The film has already opened internationally and has proven to be a bigger hit than its predecessor was, which is good news for its opening weekend. Iron Man 3 will likely take a pretty big hit due to the direct competition, while The Great Gatsby is a bit of a wild card. This weekend last year there were three wide releases, but the best of them was Battleship, which only made $25.53 million during its opening weekend, while all three new releases made a total of $53 million. Star Trek into Darkness should easily make more than that combined. However, The Avengers still dominated the chart last year and it will be that film that will be the biggest challenge in the year-over-year competition.
More...
May 12th, 2013
To no-one's great surprise, Iron Man 3 will top the box office chart again this weekend, with a very creditable projected $72.4 million, the 4th-biggest second weekend of all time. The more notable number this weekend, however, is the $51 million projected opening for The Great Gatsby. That's Baz Luhrman's best weekend by a huge margin -- in fact, only Moulin Rouge earned more than that in total domestically (and only by a small margin, with $57 million). It's also Leonardo DiCaprio's second-best weekend, behind Inception. In short, it's a great weekend for a movie that looked like a tough sell.
More...
May 7th, 2013
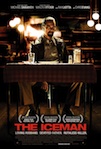
Iron Man 3 dominated the Per Theater Chart earning an average of $40,946 at over 4,000 screens. Two Millenium Films releases were next with The Iceman and What Maisie Knew earning averages of $21,987 and $21,480 respectively. Free the Mind opened with $12,215 in its lone theater.
More...
April 30th, 2013
While there were two films in the $10,000 club this week, Kon-Tiki and The Reluctant Fundamentalist, one could argue Mud had the best opening on the per theater chart this past weekend. Kon-Tiki earned an average of $11,084 in two theaters, while The Reluctant Fundamentalist earned an average of $10,307 in three. However, Mud earned an average of $6,103 while playing in 363 theaters. It missed the top ten by just $160,000.
More...
April 28th, 2013
With the Summer movie season effectively starting with the first weekend of May these days, the last weekend of April is the last chance for lesser-budgeted movies to grab some of the spotlight. This year, the movie that can hold its head up highest, at least for a few days, is Pain & Gain, which is projected to open in first place with a respectable $20 million, just $6 million less than its reported production budget. Another film that will post an excellent start is Mud, which will most likely just miss out on the top 10, but will pull in about $2.2 million from just 363 theaters for Roadside Attractions, and end with a theater average of $6,000 -- basically the same as Pain & Gain. Both films will be wiped out by Iron Man 3 when it opens on Thursday. The Summer's first behemoth has already picked up $195.3 million internationally.
More...
April 26th, 2013
There are not a huge number of limited releases opening this weekend, but there are a few that might thrive in limited release. This includes Mud, the widest limited release of the week, and also the best-reviewed. Add in a great cast, and the film might not collapse under the weight of its theater count.
More...