August 2nd, 2015
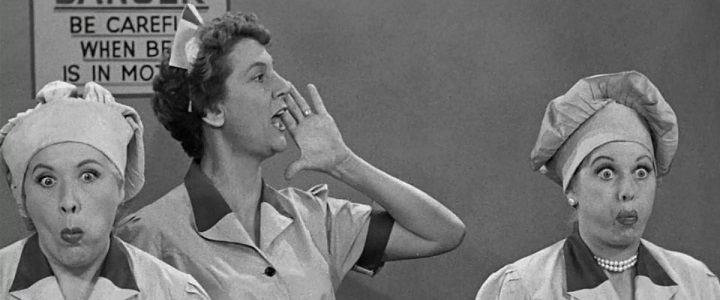
It is not overstating things to say I Love Lucy is a classic TV show. It is one of the most influential sitcoms of all time and to this day it remains one of the ten best sitcoms of all time. The show has already been released on DVD, but the second season is coming out on Blu-ray this week. Is the show worth owning? Of course. But is the Blu-ray worth the upgrade? That's a more interesting question.
More...
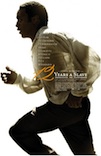
March 2nd, 2014
Independent Spirit Award handed out the hardware last night and the big winner was 12 Years a Slave, which picked up five of the seven awards it was nominated for.
More...
February 27th, 2014
With our annual Oscar Prediction contest underway, now is the best time to look at the nominees and try and figure out who the favorites are and which films should just feel honored to be nominated. We wrap up our look at the prestigious categories with the most prestigious of them all: Best Picture. Like last year, there were nine nominees. Unlike last year, none of them were completely out of left field. That's not to say they all have a legitimate shot at winning; there's definitely a favorite. However, politics could become an issue. I don't mean politics as in Democrat vs. Republican. I mean behind-the-scenes issues might play a bigger role than what is on the screen.
More...
February 27th, 2014
With our annual Oscar Prediction contest underway, now is the best time to look at the nominees and try and figure out who the favorites are and which films should just feel honored to be nominated. Today we end this with the two most prestigious awards, starting with Best Director. You could generously call this a two-horse race, but in reality there is only one director expected to win.
More...
February 25th, 2014
With our annual Oscar Prediction contest underway, now is the best time to look at the nominees and try and figure out who the favorites are and which films should just feel honored to be nominated. Today we will look at the two writing categories, starting with Best Original Screenplay. This race is twice as competitive as the Best Adapted Screenplay, by that I mean it is a two-way race for the Oscar and not a runaway race.
More...
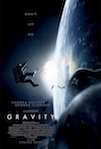
February 24th, 2014
It's a very impressive week at the top of the new DVD and Blu-ray releases. There's not one, but two $200 million hits coming out this week. Likewise, there are not one, but two major Awards Season hits coming out as well. One film, Gravity, is in both groups. All three films, Gravity, Thor: The Dark World, and Nebraska, are all contenders for Pick of the Week. Gravity is the only one I didn't get a chance to review, but the Blu-ray Combo Pack or the 3D Combo Pack are clearly the Pick of the Week. It's an amazing movie and the Blu-ray releases are loaded with extras.
More...
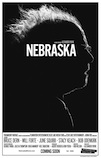
February 23rd, 2014
Nebraska is one of the major players during this year's Awards Season earning six Oscar nominations. That sets up really high expectations. Then again, it's a movie directed by Alexander Payne. That alone sets up really high expectations. Can the film live up to The Descendants' high quality? If it can't, is it still worth checking out?
More...
February 20th, 2014
With our annual Oscar Prediction contest underway, now is the best time to look at the nominees and try and figure out who the favorites are and which films should just feel honored to be nominated. This week we will look at the four acting categories, continuing with Best Lead Actor. Like last year, this category is not truly competitive with one nominee way out ahead according to experts. And also like last year, I'm supporting an underdog. (In fact, I'm cheering for two underdogs.)
More...
February 19th, 2014
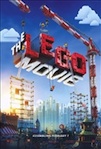
Beijing Love Story led the way on the per theater chart with an average of $18,708 in 9 theaters. This is surprisingly strong, given its weak reviews. Next up is the overall box office leader, The LEGO Movie, with an average of $13,204 and the overall second place film, About Last Night, was right behind with an average of $11,384.
More...
February 18th, 2014
With our annual Oscar Prediction contest underway, now is the best time to look at the nominees and try and figure out who the favorites are and which films should just feel honored to be nominated. This week we will look at the four acting categories, starting with Best Supporting Actress, which is again not a very competitive category this year. I'm not saying it is impossible for upset to happen here, but it is very, very unlikely. (On a side note, except for changing the links and using another poster, this is an exact cut and paste from last year. This category is slightly more competitive that last year, but not by enough to matter.)
More...
February 11th, 2014
The LEGO Movie not only earned the first place on the overall chart, but it was also the only film to top $10,000 on the per theater chart. It earned an average of $18,291, nearly doubling the average of the second place film, Kids for Cash, which earned an average of $9,160 in 4 theaters.
More...
February 9th, 2014
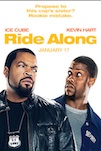
2014 is shaping up to be a good year at the box office. After excellent openings for Ride Along and Lone Survivor in January, February is getting off to a spectacular start thanks to a huge opening weekend for The LEGO Movie. Warner Bros. is projecting an opening of $69.1 million for the toy spin-off -- far and away the biggest weekend of the year so far, and the second-best February weekend ever, behind only The Passion of the Christ. Numbers like that guarantee a sequel or three, and boost a franchise that has already built an impressive following in the video market.
More...
January 28th, 2014
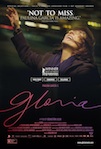
There were not a lot of new releases to do well on the per theater chart this week, but one of them, Gloria, led the way with an average of $19.592 in three theaters. A long-time release, The Great Beauty, returned to the $10,000 club with an average of $13,121 in nine theaters.
More...
January 26th, 2014
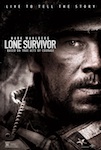
After tracking poorly for months, Lionsgate's I, Frankenstein arrived in theaters this weekend with a disappointing projected $8.275 million, according to the distributor, enough for only 6th place on a box office chart that's a jumble of Oscar hopefuls and less ambitious January fare. Ride Along tops the list with $21.1 million projected for the weekend by Universal, which also lays claim to this weekend's number two spot with Lone Survivor's $12.6 million.
More...
January 19th, 2014
Producers Guild of America announce the winners tonight, but it seems I forgot to upload the story when they announced their nominations. In my defense, they announced them on January 2nd. You don't make an announcement on January 2nd, not unless you are trying to bury a story. As for the actual nominations, there are very few differences between this group and others, except when it comes to documentaries. Then again, that's been the norm this year. No one seems to agree on what the best documentaries were.
More...
January 16th, 2014
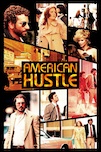
The Oscar nominations were announced this morning and there are some surprises mixed in with the predictable results. Gravity and American Hustle led the way with ten nominations each while 12 Years a Slave was right behind with nine. The fact that 12 Years a Slave wasn't the leader is the first of the surprises.
More...
January 7th, 2014
It was a slow week for new releases as none topped $10,000 on the per theater chart. There were some holdovers that performed well, led by Lone Survivor, which pulled in an average of $42,429 in two theaters. This is compared to $45,436 during its opening weekend. Such a small decline is great news for its upcoming wide expansion. August: Osage County was next with an average of $27,983 in five theaters, which is 22% lower than its opening average of $35,860. Its running tally is already at nearly half a million and it has potential to expand, especially if it continues to do well during Awards Season. The final film in the $10,000 club was Her with an average of $15,378 in 47 theaters. It is already at nearly $3 million after three weeks of release and it expands wide this weekend.
More...
January 5th, 2014
WGAs announced their nominations this weekend and there were a couple of surprises to talk about. The top of that list is 12 Years a Slave, which was deemed ineligible because it wasn't written under WGA jurisdiction. This makes using the WGAs as an Oscar guide less reliable. On the other hand, several Oscar favorites showed up as well, including American Hustle, Nebraska, and others that have picked up major nominations this year.
More...
December 17th, 2013
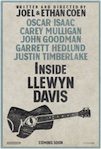
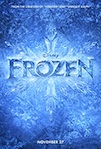
American Hustle started its box office run in limited release with a stunning average of $123,409. This is the second best per theater average for the year, behind only Frozen. Saving Mr. Banks opened in 15 theaters earning an average of $27,558. It should do well in its upcoming expansion. Inside Llewyn Davis expanded, playing in 15 theaters over the weekend while its per theater average fell to $23,786. It will continue to expand. The overall box office leader, The Hobbit: The Desolation of Smaug, was the final film in the $10,000 club earning an average of $18,869.
More...
December 14th, 2013
Hollywood Foreign Press Association announced their Golden Globe nominations this week, and a clear picture is forming. 12 Years a Slave was again the recipient of the most nominations, but this time it was a tie, as it and American Hustle both grabbed seven nominations. If you look down the list of other multi-nominated films, you will find a number of familiar faces.
More...
December 14th, 2013
SAG handed out nominations over the week, and like with the Independent Spirit Awards, 12 Years a Slave led the way and earned four nominations. It wasn't the only film that was singled out.
More...
December 12th, 2013
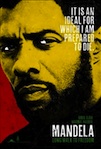
Inside Llewyn Davis had an incredible opening earning more than $400,000 in four theaters for a per theater average of $101,353. This is the third best per theater for the year behind just Frozen and Blue Jasmine. Mandela Long Walk to Freedom had a strong hold with an average of $19,413 in four theaters. The reason for this is obvious, but a little ghoulish to talk about.
More...
December 4th, 2013
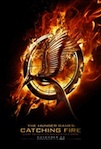
Mandela Long Walk to Freedom earned first place on the per theater chart with an average of $21,071 in four theaters. However, its reviews are only good, not great, and it likely won't have great legs. Frozen and The Hunger Games: Catching Fire were neck and neck with averages of $18,009 and $17,819 respectively.
More...
November 28th, 2013
Independent Spirit Award started the Awards Season this week, handing out its nominations. 12 Years a Slave led the way with seven nominations, but it wasn't the only film to pick up multiple nominations.
More...
November 26th, 2013
Frozen begun its short prestige release before its wide expansion on Wednesday and it was fantastic. The film pulled in $243,390 in one theater giving it the best per theater average for the year so far, topping Blue Jasmine and pushing Spring Breakers into third place. The Hunger Games: Catching Fire was in a distant second place with an average of $37,971 in more than 4,000 theaters. Philomena did very well with an average of $32,109 in four theaters. The Great Beauty remained in the $10,000 club with an average of $17,452 in three theaters. Nebraska rounded out the $10,000 club with an average of $11,634 in 28 theaters. It should continue to expand and start hitting major milestones.
More...
November 24th, 2013
As expected, The Hunger Games: Catching Fire topped Delivery Man to win at the box office this weekend. OK, topped is perhaps an understatement when the gap between the two movies is about $150 million. Catching Fire will easily record the biggest November weekend of all time, topping The Twilight Saga: New Moon. It's also heading towards the 4th-biggest weekend of all time, per Lionsgate's Sunday estimate, although there's a good chance it'll end up just behind The Dark Knight Rises' $160.8 million from last year. It will definitely end behind Iron Man 3's $174 million from earlier this year, but continued big earnings for Catching Fire over Thanksgiving means that this year's box office championship race is about to get interesting.
More...
November 20th, 2013
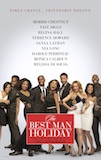
Nebraska led the way on the per theater average with an average of $35,100 in four theaters. This is not as strong as Alexander Payne's previous release, especially if you take into account the difference in the theater count between the two films. The Great Beauty was next with $23,442 in its lone theater. The Best Man Holiday was the only wide release to crack the $10,000 club earning an average of $14,875 during its opening weekend. The Book Thief and The Christmas Candle were right behind with averages of $14,501 and $14,140 respectively.
More...
November 17th, 2013
Although it's still the calm before the storm that will be Catching Fire next weekend, this weekend has a healthy look to it thanks to a stronger-than-expected debut for The Best Man Holiday, which will post about $30.5 million according to Universal's Sunday projection, more than three times the debut figure for the previous film in the franchise. That won't be enough to unseat Thor at the top of the chart though. The Marvel superhero will post about $38 million, down a reasonable 55% from its opening frame. Most other returning films are enjoying good holds too.
More...
November 15th, 2013
There are not a lot of limited releases on this week's list, but there are a few that are intriguing. Nebraska has the best reviews and an excellent pedigree. Dear Mr. Watterson is a good choice for fans of Calvin and Hobbes. While Faust is earning good enough reviews to be worth checking out, even if it will be overshadowed by some of the Oscar contenders out there.
More...