March 22nd, 2017
-8-News.jpg)
Beauty and the Beast dominated the international chart even more than it dominated the domestic one earning $180.0 million in 44 markets. The film’s worldwide opening was the second best for March, behind only Batman v Superman: Dawn of Justice; however, BvS opened truly worldwide, while Beauty and the Beast only opened in about two thirds of the international market. Unsurprisingly, the film’s biggest single market was China, where it pulled in $44.72 million over the weekend, $45.01 million including Thursday’s previews. It was also a monster hit in the U.K., where it earned $24.37 million in 567 theaters, which was the biggest March opening of all time in that market. The next biggest market was South Korea with $10.68 million on 1,625 screens over the weekend and $11.88 million in total. It also cracked $10 million in Mexico ($11.6 million); Germany ($10.7 million), and Brazil ($10.4 million). At this point, getting to $1 billion worldwide seems like a safe bet, especially with openings in France, Australia, Japan, and other markets left to go. We will of course track its progress there.
More...
March 21st, 2017
-2-News.jpg)
It is an interesting week on the home market with Rogue One: A Star Wars Story dominating the competition. However, it is only coming out on Video on Demand and doesn’t come out till Friday. As for Tuesday releases, there are a few contenders, but no film that immediately jumps out as the Pick of the Week. If you go with quality, extras, and overall audience appeal, then Sing on Blu-ray Combo Pack comes out on top. I would also definitely checkout Insecure: Season One and Lifeboat, if you don’t already own the latter.
More...
March 19th, 2017
-1-News.jpg)
Sing was the last big animated film released in 2016 and it was a good year for animated films. Both Zootopia and Finding Dory earned stunnign reviews and more than $1 billion worldwide. Sing couldn’t compete with those box office numbers, but is it at least close in terms of quality?
More...
March 8th, 2017
-3-News.jpg)
Logan dominated the international box office chart with $152.7 million in 81 markets for a worldwide opening of $240.9 million. This is almost twice as much as the film cost to make, so it has nearly paid for its entire production budget during the film’s opening weekend. Assuming it has any legs, it will break even before it reaches the home market. China was the biggest single market, as it earned $45.60 million over the weekend for a total opening of $46.38 million, including Thursday previews. The U.K. was well back with an opening of $11.48 million in 602 theaters. Up next is Brazil, which earned $8.2 million, while the film had a total opening of $8.16 million on 954 screens in South Korea, while it earned $8.02 million on 1,200 screens in Russia. The film doesn’t open in Japan until June and it could have over $500 million worldwide by then.
More...
February 16th, 2017
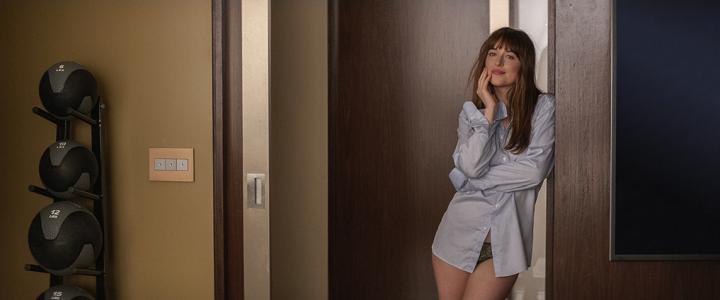
Fifty Shades Darker earned first place on the international chart during it opening weekend, pulling in $97.78 million on 9,726 screens in 57 markets. This is the biggest international weekend of the year so far, so that’s reason for the studio to celebrate. The film’s biggest market was Germany, where it made $10.5 million, while the U.K. and Ireland were close behind with $9.4 million. The film cracked $5 million in France ($8.3 million); Brazil ($7.3 million); Italy ($6.9 million); Russian ($6.5 million); Australia ($5.8 million); and Spain ($5 million). The film has yet to open in Japan, but that’s the only major market left. By the end of the first weekend of release, the film had made enough worldwide to cover its entire production budget. By the end of the second, it will likely come completely in the black. By the time it makes its initial push into the home market, it will likely have paid for the production budget of Fifty Shades Freed as well.
More...
January 24th, 2017
-2-News.jpg)
Split dominated the weekend box office earning $40.01 million, which is nearly double predictions and nearly double its nearest competition, xXx: Return of Xander Cage. The overall box office still shrunk from last weekend, but it was down just 3.2%, which is excellent for a post-holiday weekend. Compared to this weekend last year, 2017 was 27% stronger. Year-to-date, 2017 is still behind 2016, but that gap has closed to 9.4% at $736 million to $812 million.
More...
January 19th, 2017
-1-News.jpg)
It is a deceptively busy week with five films opening or expanding wide. At least that’s what the dsitributors are saying. In reality, there are only two truly wide releases, xXx: Return of Xander Cage and Split. There is also one semi-wide release, The Resurrection of Gavin Stone, as well as two semi-wide expansions, The Founder and 20th Century Women. Return of Xander Cage and Split are the only two of the films that have a shot at the top ten and they could be in a close race for first place. This weekend last year, there were three wide releases, but none of them made significantly more than $10 million at the box office. The biggest film of the weekend, The Revenant, earned just $16.01 million. 2017 could finally win in the year-over-year comparison.
More...
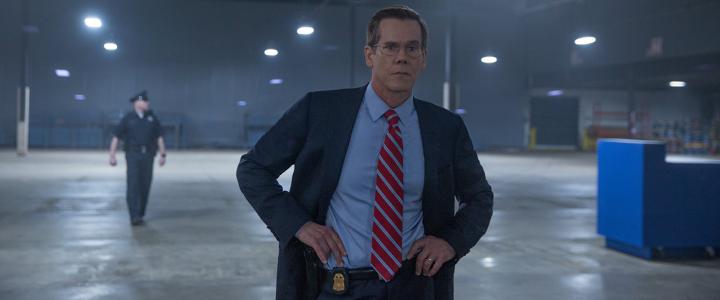
January 18th, 2017

As expected, Hidden Figures remained in first place as the box office was dominated by holdovers. The best of the new releases / wide expansions was The Bye Bye Man, which earned fifth place with $15.20 million. On the positive side, while there was only one film to earn more than $20 million over the weekend, there were seven that earned $10 million or more. That’s really good depth. It’s good enough for an 8.5% increase from last weekend reaching $149 million. However, this is still 10% lower than the same weekend last year. Year-to-date, 2017 is behind 2016 by 15% at $562 million to $659 million, but again, it is way too soon to make any predictions.
More...
January 15th, 2017

A pile-up at the box office this weekend will leave a crush of new releases behind Hidden Figures and La La Land, which remain the top two films at the box office. Hidden Figures will be down just 10% (in part thanks to expanded distribution) to $20.45 million, for $54.8 million in total, as of Sunday evening. Fox is projecting a $25.3 million 4-day weekend for the film. La La Land is even more impressive, growing its box office by 43% and moving from fifth to second on the chart with $14.5 million, and $74.1 million to date. It’s record-breaking performance at the Golden Globes has clearly lifted it to another level with audiences.
More...
January 14th, 2017

Hidden Figures unexpectedly led the way on Friday with $5.53 million. This is 28% lower than last Friday, but that was the film’s first weekend wide and this is a holiday weekend, so it should bounce back a lot over the rest of the weekend. Award-worthy reviews and continued Awards Season presence will also help the film earn about $23 million over the four-day weekend. Its running tally will be about $57 million on Monday, putting it on pace for $100 million domestically.
More...
January 12th, 2017
Six films are opening or expanding this weekend, which have a shot at the top ten. However, only one of them, Patriots Day, has a real shot at first place. In fact, it might be the only “new” film in the top five. The biggest wide release of the week is Monster Trucks, which is opening in 2,800 theaters. I didn’t see that coming. [Ed.: The final announced theater count for Monster Trucks is an even more impressive 3,119] Meanwhile, Sleepless is only opening in 1,800 theaters, while Silence is expanding into 750 theaters. We still haven’t mentioned all of the new films. As for holdovers, Hidden Figures has a real shot at first place, while La La Land should get a boost from its Awards Season success. This weekend last year, Ride Along 2 opened with just over $35 million over the three-day weekend. There’s no film that will match that figure during the four-day weekend. On the positive side, there were only four films that earned more than $10 million during the three-day weekend and this year we should have five. That’s not enough to win in the year-over-year competition. It likely won’t even be close.
More...
January 12th, 2017

Rogue One: A Star Wars Story remained in first place with $56.6 million in 57 markets for totals of $437.1 million internationally and $914.5 million worldwide. It is now in fifth place on the 2016 worldwide chart. ... The entire top five worldwide is from Disney. This is unprecedented. As for this past weekend, Rogue One earned first place in China with $30.11 million over the weekend and $30.65 million including previews. This is on par with expectations, although some were worried it would struggle due to... I was going to say weather, but is smog weather? China is currently dealing with a smog crisis and has been issuing warnings to stay inside. This is the last market for the film, but it should cruise to $1 billion on holdovers. It will likely reach second place on the 2016 worldwide chart, but I think Captain America: Civil War is safe on the top of the chart.
More...
January 10th, 2017

The first weekend of the year wasn’t as potent as anticipated, as none of the holdovers held on as well as expected. This helped Hidden Figures earn first place with $22.80 million, putting it just ahead of Rogue One: A Star Wars Story, which pulled in $22.06 million. The box office was down 26% from last weekend to $137 million, but this is a post-holiday weekend, so this decline was expected. The box office was also down 14% from this weekend last year. It is still way too soon to compare the box office year-over-year. In fact, we should wait till The Force Awakens faded out of the top five before we can really get a picture of how 2017 will do. That was President’s Day long weekend. So once we get past President’s Day long weekend, the year-over-year comparison will begin it have some real value.
More...
January 7th, 2017
It’s looking like a surprisingly close weekend at the box office. The Friday results show three films with a real shot at top spot: Hidden Figures, Rogue One: A Star Wars Story, and Sing. Hidden Figures led the way on Friday with $7.6 million, putting it on pace for between $21 million and $23 million for the weekend. There’s a wide range here, because the studio has made a push to go after African-American churchgoers, so this could really boost the film’s Sunday box office. The film’s legs will be helped by its amazing reviews, as well as its A+ rating from CinemaScore. If it does land on the high end of expectations, then it has a real shot at top spot for the weekend. It does have a lot of competition, on the other hand.
More...
January 5th, 2017

It’s the first weekend of the year and there’s only one wide release, Underworld: Blood Wars, plus one wide expansion, Hidden Figures. (As expected, A Monster Calls is not expanding truly wide and it won’t grow enough to make the top ten. I don’t think it will top $3 million over the weekend.) None of these films are really going to challenge the top two holdovers, Rogue One: A Star Wars Story and Sing, although that pair should be in a close race for first place. This weekend last year was very similar to this weekend, with one new release, one wide expansion, and a Star Wars holdover on top. Unfortunately, this year is much weaker. 2017 is going to get off on a losing note.
More...
January 5th, 2017

Rogue One: A Star Wars Story added $45.8 million in 55 markets to its running tally, which now sits at $350.0 million internationally and $775.0 million worldwide. By the end of Sunday, the film was already in tenth place for the year and while it is not doing as well internationally as it is domestically, it is still on pace to hit fifth place by as early as this weekend. Its biggest market is the U.K., where it has pulled in $64.4 million, but the U.K. might not stay on top for long, because the film opens in China this weekend.
More...
January 4th, 2017
Hidden Figures rose to first place during its first full weekend of release with an average of $34,329 in 25 theaters. It already has more than $2 million and it expands wide on Friday. 20th Century Women was next with an average of $27,800 in four theaters. It isn’t a major player during Awards Season, but it is picking up enough nominations to help it stick around in theaters. Patriots Day was down just 8% earning an average of $21,117 in seven theaters. Last week’s winner, Silence, fell to an average of $20,827 in four theaters. If it has a similar drop next week, it will put its wide release in jeopardy. The best limited release of the week was Paterson, which earned an average of $17,334 in four theaters. Toni Erdmann earned an average of $14,000 in three theaters during its first full week of release. La La Land continues to expand, but remained in the $10,000 club with an average of $12,738. The overall number one film, Rogue One: A Star Wars Story, was next with an average of $11,934, while the second place film, Sing, was right behind with an average of $10,647.
More...
January 4th, 2017

The final weekend of the year wasn’t as potent as we had predicted, but there were still a number of reasons to celebrate. Rogue One: A Star Wars Story won the weekend and is on its way to becoming the biggest hit of the year. Sing was relatively close behind and will get to $200 million this upcoming weekend. Overall, the box office rose by 2.9% from last weekend hitting $186 million. This is 15% lower than the same weekend last year, which again was actually the first weekend of 2016. We need to switch to the Strowbrinian Calendar. I’m not kidding about this. As for the year-over-year comparison, that’s a little confusing. If you just look at the calender years, then 2016 broke the record earning $11.4 billion. However, the movie year actually begins the first Monday of the year and ends the final Sunday before the first Monday of the next year. Going by this definition of the year, 2016 actually just failed to overtake 2015, because we lost a few days of The Force Awakens and only got one extra day of Rogue One.
More...
January 1st, 2017

With most studios closed for New Year’s Day, the weekend estimates have a rather piecemeal look as of this morning. We do have an official weekend estimate for Sing, which Universal projects will make $41.5 million over the three-day weekend and $53.4 million over four, for a total coming out of the holidays at an impressive $177.3 million. That will put it in second place, not far behind Rogue One: A Star Wars Story. Disney won’t be releasing numbers until tomorrow, but we should see a three-day weekend around $50 million, $65 million over four days, and a total of about $440 million by Tuesday morning.
More...
December 31st, 2016

Rogue One: A Star Wars Story and Sing continue to dominate the box office, which is great news for us, as Disney and Universal are practically the only major studios releasing numbers this weekend. The holidays are incredibly important at the box office, but they also make our job harder to do. As for the actual box office numbers, Rogue One led the way with $18.18 million on Friday for an 15-day total of $393.55 million. This is lower than expected and it will fall week-to-week; however, it will finish the three-day weekend with just over $50 million becoming the third film released in 2016 to get to $400 million domestically in the process. It also remained on pace for $500 million domestically and $1 billion worldwide.
More...
December 29th, 2016

The weekend after Christmas Day is usually a boring weekend with no wide releases to speak of. On the other hand, we do have a monster hit to keep track of, as well as some Awards Season hopefuls that are expanding significantly and could make the top ten. Of course, Rogue One: A Star Wars Story will win this weekend and it should in fact grow from last weekend, because Christmas Eve is a dead zone at the box office. Likewise, Sing should grow even better, as it is the last weekend for families to hit theaters before school starts. Some of the other films that debuted last week are not looking so good. This weekend last year was actually the first weekend of 2016, which makes it harder to compare the two weekends. Again, we need to switch to the Strowbrinian Calendar that I mentioned at the end of the December Preview. The Force Awakens earned just over $90 million and while Rogue One won’t match that, it should be closer than most were expecting.
More...
December 29th, 2016
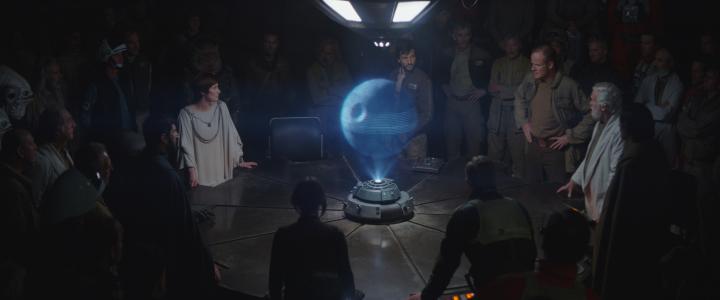
Rogue One: A Star Wars Story remained in first place with $47.1 million in 54 markets for totals of $237.4 million internationally and $523.4 million worldwide. The film “struggled” over the weekend, but mainly due to the holidays. Christmas Eve is as big of a dead zone in most of Europe as it is here; in fact, a lot of theaters close on Christmas Eve. Likewise, a lot of theaters in the U.K. and Australia are closed on Christmas day. Even so, the film has already cracked $10 million in a number of major markets, starting with the the U.K., where it has $42.1 million. Germany and France are neck-and-neck with $21.8 million and $19.6 million respectively. The film has pulled in $17.84 million in Australia and $16.7 million in Japan. Next week we will have a better picture where the film is heading, as the holidays will be over in most places. I think $1 billion worldwide is a safe bet.
More...
December 24th, 2016

Rogue One: A Star Wars Story grew by 36% on Friday, earning $22.78 million for a running tally of $244.77 million. It has now overtaken Doctor Strange for ninth place on the yearly chart. By comparison, The Force Awakens rose by 80% on this day in its run, but this day in its run was Christmas Day. As I said before, we won’t be able to really compare numbers until after Boxing Day.
More...
December 23rd, 2016

Rogue One: A Star Wars Story grew by 12% to $16.77 million on Thursday for a first-week total of $222.00 million. This shows that it was hit by new releases on Wednesday, at least a little bit. It is impossible to compare this day to The Force Awakens, because this day in its run was Christmas Eve. For the record though, The Force Awakens fell by 28% to $27.40 million on that day and had pulled in $390.86 million during the same time period.
More...
December 22nd, 2016

As expected, Rogue One: A Star Wars Story led the way on Wednesday. It fell 15% to $14.97 million on Wednesday for a 6-day total of $204.23 million. By comparison, The Force Awakens rose 2% to $38.02 million on Wednesday for a six-day total of $363.46 million; however, it didn’t have to deal with three wide releases. In fact, it’s only “new” competition was the semi-wide expansion of The Big Short. Comparing the two movies’ daily numbers will get less illuminating until we get past Boxing Day, because the misalignment in the holidays will be playing a major role in the day-to-day changes.
More...
December 21st, 2016
This week is an utter mess when it comes to new releases. There are five films opening or expanding wide this week, three of them opening on Wednesday. Assassin’s Creed, Passengers, and Sing are all trying to get a head start on the weekend, while Why Him? debuts on Friday. Finally, Fences is expected to expand wide on Sunday, Christmas Day, but we’ve seen recently that “wide expansion” isn’t a meaningful term when studios use it. None of these films are expected to top Rogue One: A Star Wars Story, or even come close. Comparing this weekend to the same weekend last year is nearly impossible, because Christmas Eve lands on Saturday this year and Christmas Eve is a dead zone at the box office, while last year it landed on the Thursday, which is the best day of the week for optimal box office numbers. On the other hand, Monday is Boxing Day, which is a holiday for some. It doesn’t balance out, but fortunately 2016 still has a substantial lead over 2015, so even a really bad weekend won’t put 2016 behind.
More...
December 12th, 2016

The Golden Globes nominations were announced and we are starting to see a few names pop up over and over again. La La Land led the way with seven nominations, but Moonlight was right behind with six and Manchester by the Sea earned five. You will be hearing those three names over and over and over again this Awards Season.
More...
December 1st, 2016

November was good, but not great. Fortunately, 2016 had a large enough lead going into November that the month only needed to be good. In fact, it could have been mediocre and 2016 would have still had an excellent shot to end the year above 2015. As for December, it’s a race between Star Wars and Star Wars. Almost no one thinks Rogue One is going to match The Force Awakens, but if Rogue One earns just half of what The Force Awakens managed, then 2016 will come out on top in the year-over-year comparison. There are only two other films with a better than 50/50 chance of hitting $100 million, Passengers and Sing. Either one could earn second place for the month, but Passengers will likely start faster. Last December, the only other film to earn more than $100 million was Daddy’s Home, which earned just a hair over $150 million. There’s a chance both Passengers and Sing will earn more than $150 million, which would be a boon to the box office. However, Star Wars: The Force Awakens was just too strong last year and it would take a miracle for 2016 to have a stronger December. That said, it would take a complete collapse for 2016 not to top 2015 in raw dollars. The growth might not be enough to keep pace with ticket price inflation, on the other hand.
More...
.jpg)