July 20th, 2010
It has been a full month since we had any real activity on the sales chart, and this is starting to take its toll on the overall numbers. New releases were almost nonexistent at the box office, but one of them, Brooklyn's Finest, still managed to top the sales chart this week, albeit with just 297,000 units sold and $4.63 million in consumer spending at retail.
More...
July 4th, 2010
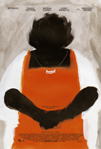
It's a terrible week for home market releases, at least in terms of potential sales. How bad is it? As I'm writing this, the best selling release on Amazon.com is The Girl With the Dragon Tatoo on DVD. That's not to say it is a bad movie; in fact, it is the Pick of the Week, but it is a foreign language limited release, and those are not exactly known for topping the charts. The Girl with the Dragon Tatoo is the Pick of the Week, but while the DVD is selling better according to Amazon.com, the Blu-ray is the better deal.
More...
March 7th, 2010
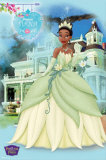
The Princess and the Frog may have slipped out of the top five internationally, but it still added $8.32 million on 3053 screens in 28 markets for a total of $143.18 million. It had no major market openings again this week, but it added $2.84 million on 689 screens over the weekend in France for a total of $27.30 million after a month of release there. This weekend the film debuted in Japan, which could help it return to the top five. Regardless, it has made enough money that it should show a profit, eventually.
More...
March 5th, 2010
With our annual Oscar Prediction contest underway, now is the best time to look at the nominees and try and figure out who the favorites are and which films should just feel honored to be nominated. Today we look at Best Actor in a Lead Role, which is yet another category with a runaway favorite.
More...
February 2nd, 2010
Oscar nominations were announced at 5:38 this morning, continuing a tradition that have never been adequately explained to me. (Why so early in the morning? Does earning an Oscar nomination become sweeter if people have to wake you up to congratulate you?) Leading the way in nominations were Avatar and The Hurt Locker, both of which pick up nine nods each, many of them in the same categories.
More...
February 2nd, 2010
Saint John of Las Vegas rode an impressive cast to the top of the per theater chart with an average of $10,833, but given its reviews, I don't think it will stick around much longer. On the other hand, Avatar has been on this list for seven weeks now earning an average $10,176 this past weekend. However, unless the Oscar nominations help it at the box office, this will be the last time it appears on this list.
More...
January 26th, 2010
Crazy Heart climbed to first place on the per theater chart with an average of $14,551 in 93 theaters. I think you could officially say it is earning some measure of mainstream success, while further wins during Awards Season will only help it grow. The Last Station slipped to second with an average of $12,409, but it also more than doubled its theater count, which is a good sign moving forward. Avatar was the only other film to top $10,000 on the per theater chart, earning an average of $11,125 in more than 3,000 theaters.
More...
January 20th, 2010
The Last Station started its run on top of the per theater chart with an average of $24,574 in three theaters, which was nearly double its nearest competitor. That film was Crazy Heart, which remained in second place with an average of $13,776. That was a decline of just 1.6% from last weekend despite some significant expansion. With a couple of Golden Globe wins, there's little doubt it will remain in theaters for some time to come.
Fish Tank was in a virtual tie with an average of $13,750 in two theaters; in fact, since that is still an estimate, it might climb into second place.
On the other hand, since Avatar was right behind with $13,025, it could slip a spot.
The final film in the $10,000 club was The Book of Eli with an average of $10,540, which was better than expected.
More...
January 12th, 2010
Avatar returned to the top of the per theater chart thanks to its record-breaking weekend result. It earned more than $50 million in 3,422 theaters for an average of $14,701. Crazy Heart was very close behind with an average of $14,004 in 33 theaters, which suggests further room to expand. Likewise, The Lovely Bones could do reasonably well this Friday when it expands after pulling in an average of $12,857 this weekend; however, there is a note of caution, as the film is still playing in only three theaters.
More...
January 5th, 2010
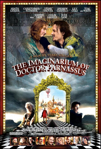
The Imaginarium of Doctor Parnassus topped the per theater chart this weekend, based on reports from theaters in the United States.
The film earned $128,000 in 4 theaters for an average of $31,909, which is roughly what it made last weekend.
It is also playing in many more theaters in Canada, but numbers have not been reported from those locations, at least so far this week.
The final figures may therefore, as last week, push the final average down considerably.
Second place went to to Lovely Bones, which climbed more than 54% to an average of $21,559 in three theaters.
This is excellent news for its planned expansion in a couple of weeks, assuming it doesn't fall by the same amount next week.
White Ribbon opened next with an average of $19,949, also in three theaters.
The overall number one film, Avatar, was just a fraction behind, earning an average of $19,789.
At this point, we've nearly run out of superlatives to describe the film's box office run and it is far from over.
Crazy Heart saw growth over the weekend, up 38% to an average of $18,416.
3 Idiots expanded somewhat and earned a very impressive average of $11,322 in 132 theaters.
A Single Man returned to the $10,000 club with an average of $10,586 in 46 theaters.
The final film in the $10,000 club was Sherlock Holmes, which fell sharply but still managed an average of $10,097.
More...
December 17th, 2009
The SAG nominations were announced this week, and the trend of the year continues with Up in the Air leading the way, but no one film dominating. This time around Up in the Air was in a three-way tie with Inglourious Basterds and Precious, which makes the race even more interesting.
More...
December 16th, 2009
The Hollywood Foreign Press Association announced their nominations this week, but looking over the list of films chosen, it is hard to declare any one film as the big winner. Up in the Air did pick up six Golden Globe nominations, including several of the most prestigious nominations, but it is far from the only major player.
More...
December 15th, 2009
Lovely Bones defied critics to open on top of the per theater chart with $38,872 in three theaters.
Up in the Air remained in second place with an average of $33,255 in 72 theaters, while it nearly reached the top ten on the overall chart.
A Single Man opened with more than $200,000 in 9 theaters for an average of $24,148.
Broken Embraces spent its fourth weekend in the $10,000 club with an average of $18,255 in six theaters.
It is starting to expand, so it should start hitting major milestones soon.
More...
December 13th, 2009
Disney claimed top spot at the box office this weekend as The Princess and the Frog expanded nationwide.
But with a weekend box office estimated at $25 million, the movie will need to have great legs over the holidays if Disney's going to recoup its investment.
The movie has good reviews and is ideal family fare, so its chances are good, but the studio is looking at the same nail biting exercise as they're going through with A Christmas Carol, which opened with $30 million and reached an estimated $124 million this weekend.
More...
December 11th, 2009
Another week, another batch of limited releases. This time of year we normally see a lot of Oscar hopefuls being released; however, half the film's on this week's list have no shot at Awards Season glory, and only one of the Oscar bait movies seems to have fulfilled its potential.
More...
December 2nd, 2009
As always, the Independent Spirit Awards represent the unofficial start of Awards Season with the announcement of their nominations.
This year The Last Station and Precious topped the list of nominees with five each.
For the former, it should help build buzz for its 2010 release.
For the latter, it is the first step towards possible Awards Season glory and further enhances its already lofty box office potential.
More...