October 7th, 2016

It is both a great week for limited releases and a terrible one. While there are a number of fantastic films, like Under the Shadow for example, there are very few that have a legitimate shot at box office success. The usual reason for this is Video on Demand. Voyage of Time will likely be the biggest hit on this week’s list, but as an IMAX film, it will likely be in theaters for years.
More...
August 9th, 2011
This week's list is highly frustrating for two reasons. Firstly, while there's a pretty big list of first-run releases, many of which had some pre-release buzz, almost none of them matched expectations. Secondly, my internet access kept cutting out, so it took till 4:30 a.m. to get this done, and by the end I was swearing nearly constantly. (Even 15 minutes of the Smooth Jazz Nyan Cat wasn't enough to calm my nerves.) Moving on... There were two main contenders for Pick of the Week, Paul on Blu-ray and Stargate: Atlantis: Complete Series Megaset on Blu-ray. In the end I went with the latter, partially because the screener for the former hasn't shown up yet.
More...
October 11th, 2004
Every week films get a second chance at success from the home market; or, in some cases, a first chance at success. Here is a list of wide releases, limited releases and a few from the growing TV on DVD section, including the winner of the DVD Pick of the Week Ren & Stimpy - The Complete First and Second Seasons -
Buy from Amazon.
More...
September 20th, 2004
Every week films get a second chance at success from the home market; or, in some cases, a first chance at success. Here is a list of wide releases, limited releases and a few from the growing TV on DVD section, including the co-winners of the DVD Pick of the Week.
Star Wars,
Star Wars,
Star Wars and of course
Star Wars - Original Trilogy -
Buy from Amazon.
More...
March 3rd, 2004
There's was not much in the way of good news this week, and what little there was was due to a single movie. The Passion of the Christ topped the per theatre chart and was the only film to top $10,000 per theatre taking in $27,554.
More...
February 26th, 2004
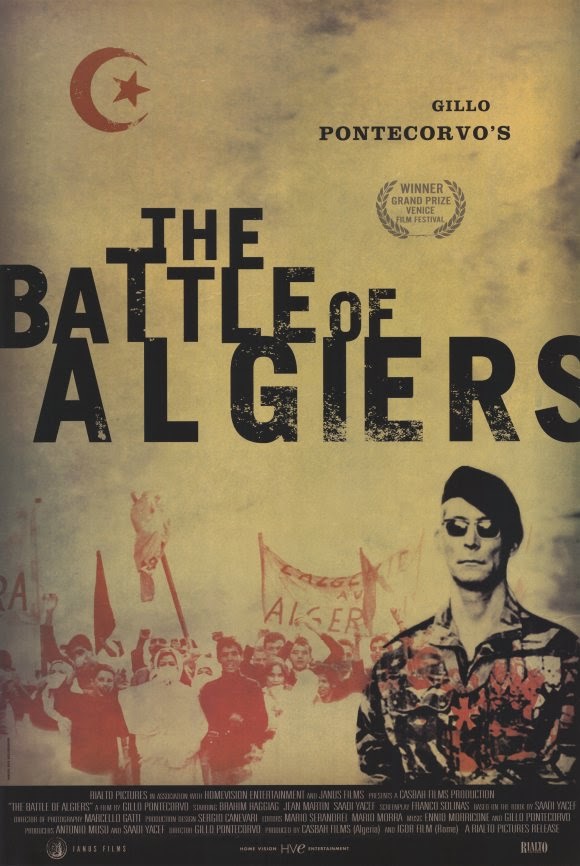
No movie managed to beak the $10,000 per theatre average this weekend. Overall the best showing was
The Battle of Algiers with $9,143. The best new limited release,
Lost Boys of Sudan, finished in second place with $7,485. In the mean time, the best wide release was way down the list in 16th place. That film,
Confessions of a Teenage Drama Queen could only manage an average of $3,736.
More...
January 21st, 2004
Not one movie made it to the $10,000 per theatre average, although a few came close. The debut of Along Came Polly came in first with $9,290 per theatre, while the second weekend for The Battle of Algiers was just behind with $9,240 per theatre. Perhaps the best performance was by Girl with a Pearl Earring, which saw an increase in both theatre count and per theatre average.
More...
January 15th, 2004
The two documentaries about famous designer,
Yves St. Laurent, finished first on the per theatre average this week. While its average of $15,385 was enough to take top spot, it is not particularly high for a movie opening in only one theatre and chances of mainstream success are not likely.
More...
January 9th, 2004
Four movies open in limited release this week, and they are an eclectic mix. Two documentaries, (one about a serial killer and the other about a world renowned designer), a very realistic war movie and a Mormon-Themed buddy comedy. While there's probably not something for everyone, it's almost guaranteed that no movie will be for everyone.
More...