March 6th, 2009
The is only one saturation level release next week, Race to Witch Mountain, and it is the target film for this week's box office prediction contest. In order to win, one must simply predict the opening weekend box office of Race to Witch Mountain.
Whoever comes the closest to predicting the film's opening 3-day weekend box office (Friday to Sunday), without going over, will win a copy of The Hills - Season Four on DVD, as well as Soul Men on DVD and Hulk Vs. on DVD.
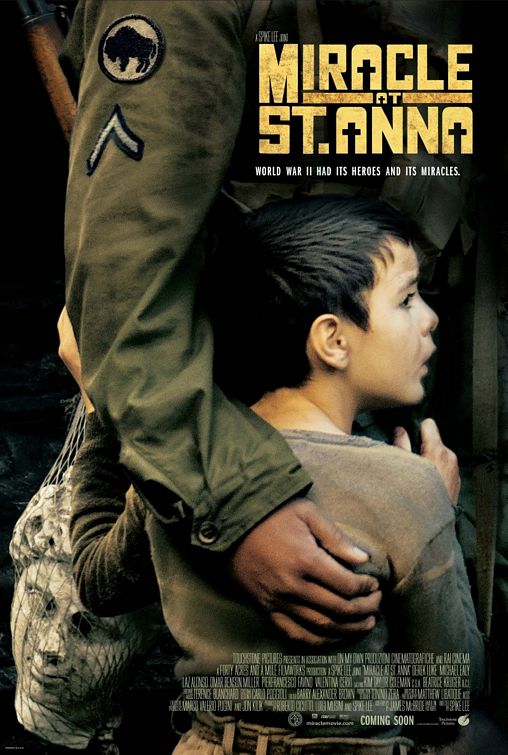
Meanwhile, whoever comes the closest to predicting the film's opening 3-day weekend box office (Friday to Sunday), without going under, will also win a copy of The Hills - Season Four on DVD, as well as Miracle at St. Anna on DVD.
Finally, one additional entrant will be chosen at random to win a third copy of The Hills - Season Four on DVD.
Entries must be received by 10 a.m., Pacific Time on Friday to be eligible, so don't delay!
More...
February 24th, 2009
There were four or five new releases to reach the top 30 on this week's sales chart depending on how you count Madagascar 2 - Escape to Africa. During its first full week of release it sold 1.83 million units, giving it totals of 3.51 million units and $56.55 million, which is easily the best sales figures for any DVD this year.
More...
February 24th, 2009
Nights in Rodanthe led a troop of five new releases to take first place on the rental charts, pulling in 16% more rental revenue than second place Madagascar 2 - Escape to Africa during its first full week on the chart.
More...
February 10th, 2009
One of the busier weeks in the past several weeks, but there's little in the way of top-notch releases. The biggest box office hit was Nights in Rodanthe, which struggled to become a mid-level hit. The best release in my opinion is My Name is Bruce on Blu-ray, but only if you are a Bruce Campbell Fanboy. I am, and I'm awarding it the DVD Pick of the Week. While there were not as many top-notch releases, there were still more than enough bulk to force this column to be split into two.
The second part can be found here.
More...
February 10th, 2009
One of the busier weeks in the past several weeks, but there's little in the way of top-notch releases. The biggest box office hit was Nights in Rodanthe, which struggled to become a mid-level hit. The best release in my opinion is My Name is Bruce on Blu-ray, but only if you are a Bruce Campbell Fanboy. I am, and I'm awarding it the DVD Pick of the Week. While there were not as many top-notch releases, there were still more than enough bulk to force this column to be split into two. The second part can be found here.
More...
February 3rd, 2009
Wow. That was... Due to technical difficulties, late deliveries, and some misfiled DVDs, this week's list is a little later than normal (but it's still Tuesday, so it's not technically late). It is also a lot larger than normal with a record number of Spotlight reviews (23 in all, or 30 if you count individual movies). There are also some very high quality releases including Zack and Miri Make a Porno on either DVD or Blu-ray. However, given the subject matter of that film, I wouldn't recommend it to everyone. The best release of the week is, Nick and Norah's Infinite Playlist on DVD or Blu-ray, but especially on Blu-ray, which is worth the upgrade. That film is the DVD Pick of the Week. With a record number of spotlight reviews, it goes without saying that the list had to be split up this week, with the first part found here, while the third part can be found here. (First time I had to separate the list into three parts.)
More...
October 7th, 2008
Of the eight films that opened or expanded on Friday, only two were able to do some serious business, while most were lucky if they topped the Mendoza line by earning more than $2,000 per theater. It was just a disaster, in many ways. That said, it was still the first weekend in October and the overall box office was up 13% from last weekend to $113 million. More importantly, it was 35% higher than the same weekend last year. Year-to-date, 2008 closed the gap with 2007. 2008 is just a little below and 2007 a little above $7.25 billion. By this time next week, 2008 could retake the lead, at least in terms of raw dollars.
More...
September 30th, 2008
It was a relatively predictable weekend at the box office with four of the top five films matching expectations, more or less. There was only one film on Thursday's column that beat expectations by a serious degree, and it was matched by another film that missed expectations by nearly the same margin. Overall the box office just climbed above nine digits, hitting $101 million over the weekend. This was 14% more than last weekend and 11% more than the same weekend last year. 2008 is still behind 2007, but by less than 1% at $7.11 billion to $7.15 billion.
More...
September 27th, 2008
An absolutely huge list of movie sites this week, however, out of the more than a dozen sites on this week's list, most have just the basics, plus a few video clips. It's really hard to get excited about that. In fact, the only site that stood out was Eagle Eye's Official Site, but even here it felt too slick and lacked the substance needed to win the Weekly Website Award.
More...
September 25th, 2008
There are seven films opening in more than 250 theaters this weekend, but this is clearly a case of quantity over quality. Only two are opening in more than 2,000 and none of the seven are earning overall positive reviews. (Most of these films don't have a real shot at a top five placing, so we will deal with many of them in our round-up of limited releases.) There's no real question on which film will top the charts this week, as Eagle Eye is practically a lock for that position. But there are questions about whether it can top last year's winner, or whether 2008 can play catch up over last year.
More...
September 1st, 2008
A pretty bland month with no wide release that look likely to surprise, either becoming a potential $100 million hit, or bombing so bad that they fail even to reach $10 million. The latter is a lot more likely, however, with a number of films that have serious obstacles to overcome, and it is very unlikely all of them will avoid bombing. On the other end of the scale, there are no films that have a legitimate shot at $100 million, while The top film of the month could make less than $70 million.
More...
June 26th, 2008
This week's round of new casting information contains updates for The Ghost, Stay Cool, The Stone Angel, and more!
More...
June 15th, 2008
This week's round of new movie release information contains release dates for Transporter 3, Hoodwinked 2, The Green Hornet and more!
More...
March 20th, 2008
This week's round of new casting information contains updates for The Grand, The Proposal, The Legend of Secret Pass, and more!
More...
January 27th, 2008
This week's round of new movie release information contains release dates for The Night Watchman, High School Musical 3, Toy Story 3 and more!
More...
October 18th, 2007
This week's round of new casting information contains updates for Miracle at St. Ana's, Star Trek XI, Wolverine, and more!
More...
October 11th, 2007
This week's round of new casting information contains updates for Avatar, Harry Potter and the Half-Blood Prince, Star Trek XI, and more!
More...
October 9th, 2007
This week another number of upcoming movies, new stars and directors have been added to our archive!
More...