Seth Rogen

Seth Rogen
By Jenn Deering Davis (Seth Rogen) [CC-BY-2.0], via Wikimedia Commons
Best known as a Leading Actor based on credits in that role in 22 films, with $1,897,817,024 worldwide aggregate box office (rank #127)
Best-known acting roles: Donkey Kong (The Super Mario Bros. Movie), Pumbaa (The Lion King), Ship Captain (Shrek the Third), Mantis (Kung Fu Panda), B.O.B. (Monsters vs. Aliens)
Best-known technical roles: Teenage Mutant Ninja Turtles: Mutant Mayhem (Producer), Neighbors (Producer), Sausage Party (Screenwriter), Good Boys (Producer), Sausage Party (Story Creator)
Most productive collaborators: Keegan-Michael Key, Chris Pratt, Aaron Horvath, Jack Black, Anya Taylor-Joy
Born: April 15, 1982 (41 years old)
                                    

  1. Summary
  2. News
  3. Acting Credits
  4. Technical Credits

Career Summary


  MoviesDomestic
Box Office
International
Box Office
Worldwide
Box Office
As an ActorLeading22$1,120,527,573$777,289,451$1,897,817,024
Supporting15$1,651,519,841$2,512,980,323$4,164,500,164
Lead Ensemble Member4$710,882,774$1,151,600,337$1,862,483,111
Cameo2$406,856,853$489,950,348$896,807,201
In Technical RolesProducer16$785,216,586$407,814,581$1,193,031,167
Screenwriter9$629,281,042$365,690,923$994,971,965
Executive Producer6$545,335,673$289,067,565$834,403,238
Story Creator5$325,449,219$106,867,067$432,316,286
Director2$107,575,377$31,306,372$138,881,749
Co-Producer1$109,449,237$66,827,602$176,276,839

Career Trend

This graph shows Seth Rogen’s score on our annual analysis of leading stars at the box office. The Star Score represents points assigned to each of the leading stars of the top 100 movies (based on box office) in the current year and two preceding years. For appearing in the number one movie in a year a star gets 100 points, the number two movie 99 points and so on..

Latest Ranking on Selected Box Office Record Lists


RecordRankAmount
Top 100 Stars in Leading Roles at the Domestic Box Office 93 $1,831,410,347
Top Above the Line Stars at the Domestic Box Office 61 $2,912,412,972
Top Stars in Cameo Roles at the Domestic Box Office 53 $406,856,853
Top Stars at the Domestic Box Office 57 $3,889,787,041
Top 100 Stars in Leading Roles at the International Box Office (Rank 101-200) 144 $1,928,889,788
Top Stars in Cameo Roles at the International Box Office 82 $489,950,348
Top Stars at the International Box Office (Rank 101-200) 114 $4,931,820,459
Top 100 Stars in Leading Roles at the Worldwide Box Office (Rank 101-200) 117 $3,760,300,135
Top Above the Line Stars at the Wordwide Box Office 84 $6,575,084,158
Top Stars in Cameo Roles at the Worldwide Box Office 60 $896,807,201
Top Stars at the Worldwide Box Office 81 $8,821,607,500
Top Grossing Co-Producer at the Domestic Box Office (Rank 401-500) 457 $109,449,237
Top Grossing Director at the Domestic Box Office (Rank 601-700) 671 $107,575,377
Top Grossing Executive Producer at the Domestic Box Office (Rank 201-300) 247 $545,335,673
Top Grossing Producer at the Domestic Box Office (Rank 101-200) 177 $785,216,586
Top Grossing Screenwriter at the Domestic Box Office (Rank 101-200) 156 $629,281,042
Top Grossing Story Creator at the Domestic Box Office (Rank 101-200) 153 $325,449,219
Top Grossing Co-Producer at the International Box Office (Rank 601-700) 695 $66,827,602
Top Grossing Director at the International Box Office (Rank 1,401-1,500) 1,500 $31,306,372
Top Grossing Executive Producer at the International Box Office (Rank 601-700) 663 $289,067,565
Top Grossing Producer at the International Box Office (Rank 401-500) 461 $407,805,291
Top Grossing Screenwriter at the International Box Office (Rank 401-500) 461 $365,690,923
Top Grossing Story Creator at the International Box Office (Rank 701-800) 745 $106,867,067
Top Grossing Co-Producer at the Worldwide Box Office (Rank 501-600) 561 $176,276,839
Top Grossing Director at the Worldwide Box Office (Rank 901-1,000) 923 $138,881,749
Top Grossing Executive Producer at the Worldwide Box Office (Rank 301-400) 398 $834,403,238
Top Grossing Producer at the Worldwide Box Office (Rank 201-300) 279 $1,193,021,877
Top Grossing Screenwriter at the Worldwide Box Office (Rank 201-300) 251 $994,971,965
Top Grossing Story Creator at the Worldwide Box Office (Rank 301-400) 332 $432,316,286

See the Acting Credits tab for all Acting Box Office Records and the Technical Credits tab for all Technical Box Office Records.


Featured Blu-ray and DVD Review: The Lion King

October 20th, 2019

The Lion King

The Lion King is one of the biggest hits of the year and one of only two films to top $1 billion internationally. It is also a remake of the 1994 animated classic of the same name and is widely considered part of the “Live-Action Disney remake” trend, although it is not live-action, but a photo-realistic, digitally-animated film. Is this enough to set it apart from the original? Or was photo-realism a mistake? More...

Featured Blu-ray and DVD Review: Long Shot

July 29th, 2019

Long Shot

Long Shot is a romantic comedy starring Charlize Theron and Seth Rogen that opened in May. It missed expectations at the box office barely matching its $40 million production budget worldwide. Was there a reason moviegoers were smart to stay away? Or was it an unfortunate victim of a soft box office? More...

Long Shot Trailer

February 26th, 2019

Romantic comedy starring Seth Rogen and Charlize Theron opens May 3 ... Full Movie Details.

Fred Flarsky is a gifted and free-spirited journalist with an affinity for trouble. Charlotte Field is one of the most influential women in the world. Smart, sophisticated, and accomplished, she’s a powerhouse diplomat with a talent for… well, mostly everything. The two have nothing in common, except that she was his babysitter and childhood crush. When Fred unexpectedly reconnects with Charlotte, he charms her with his self-deprecating humor and his memories of her youthful idealism. As she prepares to make a run for the Presidency, Charlotte impulsively hires Fred as her speechwriter, much to the dismay of her trusted advisors. A fish out of water on Charlotte’s elite team, Fred is unprepared for her glamorous lifestyle in the limelight. However, sparks fly as their unmistakable chemistry leads to a round-the-world romance and a series of unexpected and dangerous incidents. More...

2016 Preview: August

August 1st, 2016

Suicide Squad

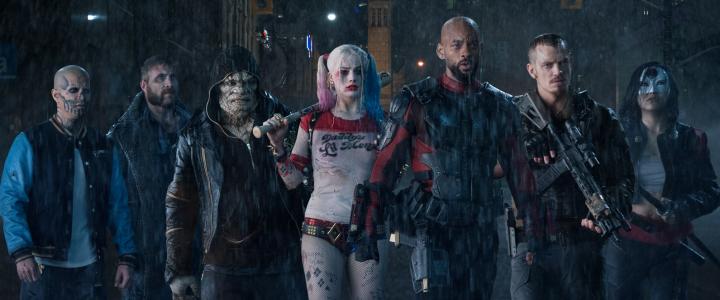
July did reasonably well, thanks mostly to The Secret Life of Pets, which will top $300 million shortly and could earn double its nearest competitor when all is said and done. That said, there were also a quartet of $100 million hits as well, so the month had good depth as well. August isn’t as lucky. There is one film that is expected to earn $100 million during its opening weekend, Suicide Squad, and one more that is expected to reach $100 million in total, Pete’s Dragon. There could be a surprise hit among the rest of the releases, (my long shot with a shot is Sausage Party) but for the most part, the rest of the wide releases would be happy with just $50 million at the box office. Last August was a disaster and Straight Outta Compton was the only hit of the month. Unless Suicide Squad bombs compared to expectations, 2016 will come out ahead in the year-over-year comparison. More...

2016 Preview: May

May 1st, 2016

Captain America: Civil War

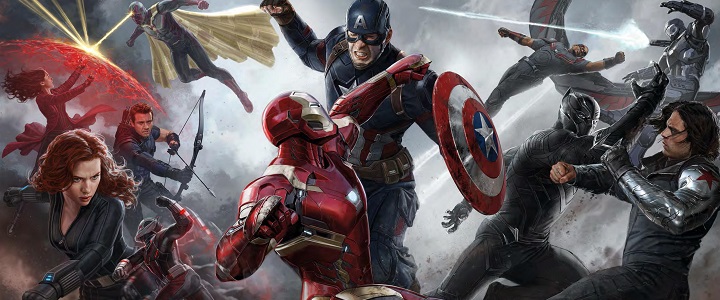
April started on a soft note and ended weak, but thanks to The Jungle Book, overall the month was actually really good. That's what happens when you get a surprise $300 million hit. This bodes well for May, which is both a slow month and a fantastic month. There are only four weekends and only eight movies coming out, but of those eight films, five have a shot at $100 million. The potential blockbusters are led by Captain America: Civil War, which is not only going to be the biggest hit of the month, but according to a Fandango survey, it is the most anticipated film of the summer. (On a side note, Finding Dory is the most anticipated family film of the summer and Ghostbusters is the most anticipated comedy of the summer. I was surprised by the last result.) Both Alice Through the Looking Glass and X-Men: Apocalypse have real shots at $200 million. One of them could get to $300 million, if they weren't opening against each other. Overall, the month looks excellent. Even better, last May there was only one monster hit, The Avengers: Age of Ultron, and most analysts think Captain America: Civil War will beat it at the box office. (There's also the issue of the misalignment in the weekends, which hurt April, but will really help May.) More...

2015 Preview: November

November 1st, 2015

The Hunger Games: Mockingjay - Part 2

October has come to an end and everyone should be happy about that. Except for The Martian, there were no serious hits that opened last month. There were more outright bombs than even midlevel hits. Fortunately, October of last year wasn't spectacular either, so 2015 maintains a healthy lead over 2014. Even more fortunately, November looks fantastic. There are four films that have the potential to earn $200 million or more. The biggest of these is the final Hunger Games movie, which should reach $400 million. Spectre has a real shot at $300 million and could be the biggest hit in the franchise. Meanwhile, nearly every November there's an animated kids movie that becomes a monster hit. This year, The Peanuts Movie and The Good Dinosaur are both aiming for that box office milestone. The last time we didn't have a family film that earned at least $100 million in November was 2011 and that's because there were four family films that opened in the final two weeks of the month and that much competition meant they cannibalized each other. Both of these has a shot at $200 million and if neither of them reached $200 million, I would be shocked. Meanwhile, last November was a good month at the top with three monster hits: The Hunger Games: Mockingjay, Part 1, Big Hero 6, and Interstellar. However, after those three films, there were not much positive to talk about. It really looks like 2015 will match 2014 at the top, plus it could have better depth. I might be a little too optimistic, but I think November is going to be a great month at the box office. More...

2015 Preview: October

October 1st, 2015

The Martian

September ended on a record note with the debut of Hotel Transylvania 2. Additionally, there was great depth and 2015's lead over 2014 grew to nearly $500 million. How do things look going forward? The month starts out with The Martian, which should have no trouble becoming the biggest hit of the month and might even top $200 million. On the other hand, no other film is expected to get to $100 million. There's only one or two that will even come close. Fortunately, last October was very similar with one $100 million hit, Gone Girl, while two other films came close, Annabelle and Fury. It looks like it will be up to the depth films from both years to determine which year comes out on top. More...

2014 Preview: December

December 1st, 2014

The Hobbit: The Battle of the Five Armies poster

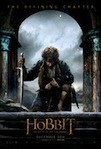
November is over and there are not a lot of positive things to say about what happened during the month. There were a couple of films that matched expectations, but there were no breakout hits and a few that missed expectations by wide margins. Granted, The Hunger Games: Mockingjay, Part 1 will top $300 million with relative ease, but that's still nearly $100 million lower than some people were predicting. The month ends with 2014 about $300 million behind 2013's pace and there's really no chance to catch up in December. That doesn't mean there are no films that will be worth watching in December. The Hobbit: The Battle of the Five Armies should at least earn $200 million, while $300 million is not out of the question. Additionally, there are several films that at least have a shot at $100 million at the box office, but not all will get there. At least this December and last December are on par with each other. The Hobbit: The Desolation of Smaug topped $250 million while there were three others that topped $100 million. I think we will get the same result this month. Last year there were a lot more wide releases, but many of them bombed. I think this year the lack of competition will help more films reach their potential. More...

2014 - Holiday Gift Guide - Part I

November 26th, 2014

This Thursday is Thanksgiving, which means this is Black Friday and Cyber Monday, and a ton of shopping. It also means the first installment of our Holiday Gift Guide. Over the next month, we will talk about TV on DVD releases, independent releases, foreign language releases, classics, etc. but this week we start with Major Movie Releases. These are first run releases, franchise box sets, etc. In some ways, this is better than last year, as there were a wider number of big releases that would make great gifts. However, in other ways it is much weaker. I can't think of a single big franchise box set that came out this year. There are some smaller ones, like the Halloween Box Set, but while the franchise has lasted ten installments and 30 years, how many can you really say are worth repeated viewing? Fortunately, there were plenty of great films to come out this year, starting with what is currently the biggest hit of the year. More...

Featured Blu-ray / DVD Review: Neighbors

September 22nd, 2014

This summer was terrible at the box office with no $250 million hits throughout the summer until Guardians of the Galaxy opened in August. That said, there were a number of smaller movies that did quite well at the box office. Neighbors, for instance, cost less than $20 million to make, but pulled in $150 million at the box office. Was it a hit because of its quality? Or did it benefit from the weakness in the tentpole releases? More...

Weekend Estimates: Neighbors Tops $50 Million

May 11th, 2014

Neighbors poster

Comedy triumphs at the box office this weekend, with Neighbors posting an impressive $51 million, according to Universal’s Sunday morning estimate. That’s the 16th-biggest opening ever for a comedy film (depending somewhat on one’s definition of what constitutes a comedy), and comparable to the debut of Ted (which made $54 million in 2012). It’s also easily Seth Rogen’s best weekend, ahead of the $33.5 million debut for The Green Hornet, and Zac Efron’s best, beating High School Musical: Senior Year. More...

2014 Preview: May

May 1st, 2014

The Amazing Spider-Man 2 poster

It has been a great year so far and April was again a strong month. The box office was led by Captain America: The Winter Soldier, as it became the second film of the year to reach $200 million, while Rio 2 is on pace to become the seventh $100 million hit of the year. Big picture, 2014 has already hit $3 billion, which isn't a record for this time of the year, but it is $250 million ahead of 2013. That streak ends in May. Don't get me wrong. There are six films opening this month that at least have a shot at $100 million and two of those should earn more than $200 million and there are two others that at least have a shot at that milestone. Leading the way is The Amazing Spider-Man 2, which is looking to top The Winter Soldier and become the second biggest hit of the year so far. Its main competition this month is X-men: Days of Future Past, while Godzilla also has a shot at $200 million. Unfortunately, this month last year, Iron Man 3 earned more than $400 million, while two other films took in $200 million and seven films in total reached the century mark. That is going to be really hard to replicate this year and 2014 will likely lose some of its lead over 2013. Fortunately, 2014 has such a big lead that unless the box office really slumps, it will end the month with at least a small lead over 2013. More...

2013 Preview: June

June 2nd, 2013

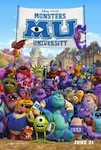
May ended on a mixed note, but there was still enough to celebrate. Of the seven films I thought had a legitimate shot at $100 million, four have already gotten there, one more is a sure thing, and another has a good shot as well. Only one, After Earth, will definitely fail to get to that milestone. (Although Now You See Me might get there instead.) Looking forward to June, there are four weekends, each with two wide releases, for a total of eight films. Of those eight, six have a legitimate shot at $100 million. One, Monsters University, should have no trouble getting to $200 million, and another, Man of Steel, should top $300 million. It is hard to compare this June with last June, because last June there were five weekends. Taking that into account and ignoring the first week, which lines up with the final week of May, there were eight wide releases. Of those eight, five hit $100 million, including three $200 million movies. There were no $300 million movies, so if the two big hits this month do as well as expected, 2013 could come out ahead. More...

Featured Blu-ray / DVD Review: The Guilt Trip

April 28th, 2013

The Guilt Trip came out a week before Christmas, which is a great time of year to release a film. However, while it lived up to modest expectations, it was far from a hit at the box office. This is partially due to the huge amount of films released over the course of one week, but would it have thrived had it had the weekend to itself? More...

2012 Preview: December

December 1st, 2012

November was a strong month and left 2012 with a very easy path to a new all time record. There was only one major miss the entire month, Rise of the Guardians, while The Silver Linings Playbook was pulled from wide release at the last minute, so it is a little hard to judge its box office performance. On the positive side, Skyfall might top original expectations by $100 million. All this December has to do is maintain pace with last December to ensure 2012 sets the new record. I would like to say that will be easy to do, but I really don't know. Last year, there was only one $200 million hit, Mission: Impossible - Ghost Protocol, plus a few others that reached $100 million, so the bar isn't set too high. This year, The Hobbit: An Unexpected Journey is expected to at least come close to $300 million. Some think it will earn more than $400 million. However, it could also be the last film to make $100 million till February. December is normally a very good month to release a film, but the release schedule is so messed up that it makes it very hard to predict what will happen. There appears to be just ten films opening truly wide this month (I'm getting mixed signals on a few of them). That's a really light schedule for a month and a light schedule tends to help maximize the box office potential for individual films. However, eight of these films open wide within a seven-day period. That's insane. There's no way all of those films will find an audience and there's a chance that due to the competition, none of them will. Let's hope the situation isn't as bad as that, but there are some serious reasons to be concerned for most new releases coming out this month. More...

All Acting Credits

Announced (Undated)

Good Fortune

Register with The Numbers for free to customize this chart.

Release
Date
TitleRoleDomestic
Box Office
International
Box Office
Worldwide
Box Office
Sep 15, 2023Dumb Money $13,919,484$4,037,426$17,956,910
Apr 5, 2023The Super Mario Bros. … Donkey Kong $574,934,330$788,467,108$1,363,401,438
Nov 11, 2022The Fabelmans Bennie Loewy $17,348,945$25,932,195$43,281,140
Oct 16, 2020The Trial of the Chica… Jerry Rubin $116,473$116,473
Aug 6, 2020An American Pickle Herschel Greenbau… $499,737$499,737
Sep 20, 2019Zeroville “Viking Man” $65,424$65,424
Jul 19, 2019The Lion King Pumbaa $543,638,043$1,102,468,736$1,646,106,779
May 3, 2019Long Shot Fred Flarsky $30,316,271$23,308,153$53,624,424
Aug 3, 2018Like Father
Dec 1, 2017The Disaster Artist Sandy Schklair $21,120,616$7,597,051$28,717,667
Aug 12, 2016Sausage Party Frank/Sergeant Pe… $97,670,358$43,673,897$141,344,255
May 20, 2016Neighbors 2: Sorority … Mac Radner $55,340,730$53,416,891$108,757,621
Jan 29, 2016Kung Fu Panda 3 Mantis $143,528,619$377,642,206$521,170,825
Nov 20, 2015The Night Before Isaac $43,035,725$9,532,374$52,568,099
Oct 9, 2015Steve Jobs Steve Wozniak $17,766,658$17,812,349$35,579,007
May 9, 2014Neighbors Mac Radner $150,086,800$120,857,628$270,944,428
Feb 6, 2014The Interview Aaron Rapaport $6,105,175$6,237,457$12,342,632
Jun 12, 2013This is the End Seth Rogen $101,470,202$25,068,915$126,539,117
Dec 19, 2012The Guilt Trip Andrew Brewster $37,134,215$4,608,102$41,742,317
Nov 6, 2012Kung Fu Panda Holiday Mantis
Jun 29, 2012Take This Waltz Lou $1,239,692$3,623,640$4,863,332
Sep 30, 201150/50 Kyle $35,016,118$6,318,617$41,334,735
May 26, 2011Kung Fu Panda 2 Mantis $165,249,063$499,588,484$664,837,547
Mar 18, 2011Paul Paul $37,412,945$63,749,161$101,162,106
Jan 14, 2011The Green Hornet Brit Reid/The Gre… $98,780,042$130,375,461$229,155,503
Jul 31, 2009Funny People Ira Wright $51,855,045$20,025,260$71,880,305
Apr 10, 2009Observe and Report Ronnie Barnhardt $24,007,324$3,141,574$27,148,898
Mar 27, 2009Monsters vs. Aliens B.O.B. $198,351,526$183,335,854$381,687,380
Feb 6, 2009Fanboys Admiral Seasholts… $687,609$386,085$1,073,694
Oct 31, 2008Zack and Miri Make a P… Zack $31,457,946$5,398,360$36,856,306
Aug 6, 2008Pineapple Express Dale Denton $87,341,380$15,062,639$102,404,019
Jun 6, 2008Kung Fu Panda Mantis $215,434,591$416,475,940$631,910,531
Mar 14, 2008Horton Hears a Who Morton $154,529,439$144,948,447$299,477,886
Feb 14, 2008The Spiderwick Chronicles Hogsqueal $71,195,053$91,644,614$162,839,667
Aug 17, 2007Superbad Officer Michaels $121,463,226$48,491,916$169,955,142
Jun 1, 2007Knocked Up Ben Stone $148,761,765$70,504,187$219,265,952
May 17, 2007Shrek the Third Ship Captain $322,719,944$484,610,992$807,330,936
Jul 14, 2006You, Me and Dupree Neil $75,802,010$54,600,000$130,402,010
Aug 19, 2005The 40 Year-old Virgin Cal $109,449,237$66,827,602$176,276,839
Jul 9, 2004Anchorman: The Legend … Eager Cameraman $84,136,909$5,339,356$89,476,265
Oct 26, 2001Donnie Darko Ricky Danforth $1,480,006$6,030,148$7,510,154
 
Averages $108,049,640$126,456,935$226,195,064
Totals 41 $3,889,787,041$4,931,820,459$8,821,607,500


Leading or Lead Ensemble Roles


Register with The Numbers for free to customize this chart.

Release
Date
TitleOpening
Weekend
Maximum
Theaters
Domestic
Box Office
Worldwide
Box Office
Domestic
Share
Sep 15, 2023Dumb Money $220,9472,837$13,919,484$17,956,91077.5%
Nov 11, 2022The Fabelmans $161,5791,962$17,348,945$43,281,14040.1%
Oct 16, 2020The Trial of the Chica… $116,473
Aug 6, 2020An American Pickle $499,737
Jul 19, 2019The Lion King $191,770,7594,802$543,638,043$1,646,106,77933.0%
May 3, 2019Long Shot $9,740,0643,230$30,316,271$53,624,42456.5%
Dec 1, 2017The Disaster Artist $1,211,3451,010$21,120,616$28,717,66773.5%
Aug 12, 2016Sausage Party $34,263,5343,135$97,670,358$141,344,25569.1%
May 20, 2016Neighbors 2: Sorority … $21,760,4053,416$55,340,730$108,757,62150.9%
Nov 20, 2015The Night Before $9,880,5362,960$43,035,725$52,568,09981.9%
May 9, 2014Neighbors $49,033,9153,311$150,086,800$270,944,42855.4%
Feb 6, 2014The Interview 581$6,105,175$12,342,63249.5%
Jun 12, 2013This is the End $20,719,1623,055$101,470,202$126,539,11780.2%
Dec 19, 2012The Guilt Trip $5,290,6292,431$37,134,215$41,742,31789.0%
Jun 29, 2012Take This Waltz $137,01969$1,239,692$4,863,33225.5%
Sep 30, 201150/50 $8,644,0952,479$35,016,118$41,334,73584.7%
Mar 18, 2011Paul $13,043,3102,806$37,412,945$101,162,10637.0%
Jan 14, 2011The Green Hornet $33,526,8763,584$98,780,042$229,155,50343.1%
Jul 31, 2009Funny People $22,657,7803,008$51,855,045$71,880,30572.1%
Apr 10, 2009Observe and Report $11,017,3342,727$24,007,324$27,148,89888.4%
Mar 27, 2009Monsters vs. Aliens $59,321,0954,136$198,351,526$381,687,38052.0%
Oct 31, 2008Zack and Miri Make a P… $10,065,6302,735$31,457,946$36,856,30685.4%
Aug 6, 2008Pineapple Express $23,245,0253,072$87,341,380$102,404,01985.3%
Jun 1, 2007Knocked Up $30,690,9902,975$148,761,765$219,265,95267.8%
 
Averages $26,495,3352,742$83,245,925$156,679,17263.5%
Totals 24 $1,831,410,347$3,760,300,135


Supporting Roles


Register with The Numbers for free to customize this chart.

Release
Date
TitleOpening
Weekend
Maximum
Theaters
Domestic
Box Office
Worldwide
Box Office
Domestic
Share
Apr 5, 2023The Super Mario Bros. … $146,361,8654,371$574,934,330$1,363,401,43842.2%
Sep 20, 2019Zeroville $65,424
Aug 3, 2018Like Father
Jan 29, 2016Kung Fu Panda 3 $41,282,0423,987$143,528,619$521,170,82527.5%
Oct 9, 2015Steve Jobs $521,5222,493$17,766,658$35,579,00749.9%
Nov 6, 2012Kung Fu Panda Holiday
May 26, 2011Kung Fu Panda 2 $47,656,3023,952$165,249,063$664,837,54724.9%
Feb 6, 2009Fanboys $171,53346$687,609$1,073,69464.0%
Jun 6, 2008Kung Fu Panda $60,239,1304,136$215,434,591$631,910,53134.1%
Mar 14, 2008Horton Hears a Who $45,012,9983,961$154,529,439$299,477,88651.6%
Feb 14, 2008The Spiderwick Chronicles $19,004,0583,847$71,195,053$162,839,66743.7%
Aug 17, 2007Superbad $33,052,4113,069$121,463,226$169,955,14271.5%
Jul 14, 2006You, Me and Dupree $21,525,5603,137$75,802,010$130,402,01058.1%
Aug 19, 2005The 40 Year-old Virgin $21,422,8153,006$109,449,237$176,276,83962.1%
Oct 26, 2001Donnie Darko $110,49458$1,480,006$7,510,15419.7%
 
Averages $36,363,3943,005$137,626,653$320,346,16645.8%
Totals 15 $1,651,519,841$4,164,500,164

Latest Ranking on All Acting Box Office Record Lists


RecordRankAmount
Top 100 Stars in Leading Roles at the Domestic Box Office 93 $1,831,410,347
Top 100 Stars in Supporting Roles at the Domestic Box Office (Rank 201-300) 226 $1,651,519,841
Top Live Action Stars at the Domestic Box Office (Rank 501-600) 580 $1,280,986,221
Top Above the Line Stars at the Domestic Box Office 61 $2,912,412,972
Top Below the Line Stars at the Domestic Box Office (Rank 1,401-1,500) 1,453 $484,826,478
Top Stars in Cameo Roles at the Domestic Box Office 53 $406,856,853
Top Stars at the Domestic Box Office 57 $3,889,787,041
Top 100 Stars in Leading Roles at the International Box Office (Rank 101-200) 144 $1,928,889,788
Top 100 Stars in Supporting Roles at the International Box Office (Rank 201-300) 222 $2,512,980,323
Top Live Action Stars at the International Box Office (Rank 2,201-2,300) 2,262 $729,875,664
Top Above the Line Stars at the International Box Office (Rank 101-200) 107 $3,662,671,186
Top Below the Line Stars at the International Box Office (Rank 2,601-2,700) 2,645 $550,966,581
Top Stars in Cameo Roles at the International Box Office 82 $489,950,348
Top Stars at the International Box Office (Rank 101-200) 114 $4,931,820,459
Top 100 Stars in Leading Roles at the Worldwide Box Office (Rank 101-200) 117 $3,760,300,135
Top 100 Stars in Supporting Roles at the Worldwide Box Office (Rank 201-300) 225 $4,164,500,164
Top Live Action Stars at the Worldwide Box Office (Rank 1,001-1,100) 1,082 $2,010,861,885
Top Above the Line Stars at the Wordwide Box Office 84 $6,575,084,158
Top Below the Line Stars at the Worldwide Box Office (Rank 2,001-2,100) 2,064 $1,035,793,059
Top Stars in Cameo Roles at the Worldwide Box Office 60 $896,807,201
Top Stars at the Worldwide Box Office 81 $8,821,607,500
Highest Grossing Stars of 2007 at the Domestic Box Office (Rank 101-200) 108 87
Highest Grossing Stars of 2008 at the Domestic Box Office 34 162
Highest Grossing Stars of 2009 at the Domestic Box Office 20 204
Highest Grossing Stars of 2010 at the Domestic Box Office 88 117
Highest Grossing Stars of 2011 at the Domestic Box Office 90 118
Highest Grossing Stars of 2012 at the Domestic Box Office (Rank 101-200) 131 94
Highest Grossing Stars of 2013 at the Domestic Box Office 64 160
Highest Grossing Stars of 2014 at the Domestic Box Office 42 165
Highest Grossing Stars of 2015 at the Domestic Box Office 41 181
Highest Grossing Stars of 2016 at the Domestic Box Office 50 156
Highest Grossing Stars of 2017 at the Domestic Box Office (Rank 201-300) 230 75
Highest Grossing Stars of 2018 at the Domestic Box Office (Rank 401-500) 471 41
Highest Grossing Stars of 2019 at the Domestic Box Office (Rank 501-600) 590 20
Highest Grossing Stars of 2020 at the Domestic Box Office (Rank 501-600) 502 20
Highest Grossing Stars of 2021 at the Domestic Box Office (Rank 401-500) 465 20
Highest Grossing Stars of 2022 at the Domestic Box Office (Rank 301-400) 372 45
Highest Grossing Stars of 2023 at the Domestic Box Office (Rank 401-500) 427 57
Highest Grossing Stars of 2024 at the Domestic Box Office (Rank 301-400) 333 57
Highest Grossing Stars of 2007 at the International Box Office (Rank 101-200) 173 56
Highest Grossing Stars of 2008 at the International Box Office (Rank 101-200) 198 56
Highest Grossing Stars of 2009 at the International Box Office (Rank 201-300) 236 56
Highest Grossing Stars of 2011 at the International Box Office (Rank 101-200) 181 77
Highest Grossing Stars of 2012 at the International Box Office (Rank 101-200) 167 77
Highest Grossing Stars of 2013 at the International Box Office (Rank 101-200) 187 77
Highest Grossing Stars of 2014 at the International Box Office (Rank 201-300) 281 55
Highest Grossing Stars of 2015 at the International Box Office (Rank 201-300) 265 55
Highest Grossing Stars of 2016 at the International Box Office (Rank 201-300) 296 55
Highest Grossing Stars of 2022 at the International Box Office (Rank 401-500) 425 15
Highest Grossing Stars of 2023 at the International Box Office (Rank 401-500) 491 15
Highest Grossing Stars of 2024 at the International Box Office (Rank 301-400) 390 15
Highest Grossing Stars of 2007 at the Worldwide Box Office (Rank 101-200) 127 76
Highest Grossing Stars of 2008 at the Worldwide Box Office 57 114
Highest Grossing Stars of 2009 at the Worldwide Box Office 52 137
Highest Grossing Stars of 2010 at the Worldwide Box Office (Rank 201-300) 246 61
Highest Grossing Stars of 2011 at the Worldwide Box Office (Rank 101-200) 109 99
Highest Grossing Stars of 2012 at the Worldwide Box Office (Rank 101-200) 185 76
Highest Grossing Stars of 2013 at the Worldwide Box Office 91 120
Highest Grossing Stars of 2014 at the Worldwide Box Office 78 116
Highest Grossing Stars of 2015 at the Worldwide Box Office 81 116
Highest Grossing Stars of 2016 at the Worldwide Box Office (Rank 101-200) 128 93
Highest Grossing Stars of 2017 at the Worldwide Box Office (Rank 401-500) 482 21
Highest Grossing Stars of 2018 at the Worldwide Box Office (Rank 501-600) 514 21
Highest Grossing Stars of 2022 at the Worldwide Box Office (Rank 401-500) 429 22
Highest Grossing Stars of 2023 at the Worldwide Box Office (Rank 501-600) 507 22
Highest Grossing Stars of 2024 at the Worldwide Box Office (Rank 401-500) 405 22
Top Domestic Leading Stars for Original Screenplay Movies 91 $801,765,371
Top Domestic Leading Stars for Based on Comic/Graphic Novel Movies (Rank 101-200) 173 $198,351,526
Top Domestic Leading Stars for Based on Real Life Events Movies (Rank 101-200) 134 $52,365,063
Top Domestic Leading Stars for Based on TV Movies (Rank 101-200) 136 $98,780,042
Top Domestic Leading Stars for Remake Movies 5 $543,638,043
Top Domestic Leading Stars for Based on Factual Book/Article Movies (Rank 101-200) 174 $35,040,100
Top Domestic Leading Stars for Based on Short Film Movies 12 $101,470,202
Top International Leading Stars for Original Screenplay Movies (Rank 201-300) 299 $443,639,060
Top International Leading Stars for Based on Comic/Graphic Novel Movies (Rank 201-300) 234 $183,335,854
Top International Leading Stars for Based on Real Life Events Movies (Rank 101-200) 185 $32,250,812
Top International Leading Stars for Based on TV Movies (Rank 101-200) 135 $130,375,461
Top International Leading Stars for Remake Movies 4 $1,102,468,736
Top International Leading Stars for Based on Factual Book/Article Movies (Rank 201-300) 203 $11,634,477
Top International Leading Stars for Based on Movie Movies (Rank 101-200) 166 $116,473
Top International Leading Stars for Based on Short Film Movies 52 $25,068,915
Top Worldwide Leading Stars for Original Screenplay Movies (Rank 101-200) 160 $1,245,404,431
Top Worldwide Leading Stars for Based on Comic/Graphic Novel Movies (Rank 201-300) 210 $381,687,380
Top Worldwide Leading Stars for Based on Real Life Events Movies (Rank 101-200) 171 $84,615,875
Top Worldwide Leading Stars for Based on TV Movies (Rank 101-200) 138 $229,155,503
Top Worldwide Leading Stars for Remake Movies 2 $1,646,106,779
Top Worldwide Leading Stars for Based on Factual Book/Article Movies (Rank 101-200) 187 $46,674,577
Top Worldwide Leading Stars for Based on Movie Movies (Rank 201-300) 207 $116,473
Top Worldwide Leading Stars for Based on Short Film Movies 39 $126,539,117
Top Domestic Leading Stars for Live Action Movies (Rank 101-200) 119 $991,750,420
Top Domestic Leading Stars for Animation/Live Action Movies 93 $543,638,043
Top Domestic Leading Stars for Digital Animation Movies (Rank 101-200) 103 $296,021,884
Top International Leading Stars for Live Action Movies (Rank 301-400) 319 $599,411,301
Top International Leading Stars for Animation/Live Action Movies 78 $1,102,468,736
Top International Leading Stars for Digital Animation Movies (Rank 201-300) 225 $227,009,751
Top Worldwide Leading Stars for Live Action Movies (Rank 101-200) 195 $1,591,161,721
Top Worldwide Leading Stars for Animation/Live Action Movies 80 $1,646,106,779
Top Worldwide Leading Stars for Digital Animation Movies (Rank 101-200) 165 $523,031,635
Top Domestic Leading Stars for Contemporary Fiction Movies 92 $701,698,186
Top Domestic Leading Stars for Science Fiction Movies (Rank 101-200) 187 $138,883,147
Top Domestic Leading Stars for Kids Fiction Movies 24 $741,989,569
Top Domestic Leading Stars for Super Hero Movies (Rank 201-300) 216 $98,780,042
Top Domestic Leading Stars for Fantasy Movies (Rank 101-200) 186 $97,670,358
Top Domestic Leading Stars for Dramatization Movies (Rank 201-300) 212 $52,389,045
Top International Leading Stars for Contemporary Fiction Movies (Rank 201-300) 269 $342,034,882
Top International Leading Stars for Science Fiction Movies (Rank 301-400) 327 $89,317,813
Top International Leading Stars for Kids Fiction Movies 24 $1,285,804,590
Top International Leading Stars for Super Hero Movies (Rank 201-300) 211 $130,375,461
Top International Leading Stars for Fantasy Movies (Rank 401-500) 435 $43,673,897
Top International Leading Stars for Dramatization Movies (Rank 201-300) 228 $37,683,145
Top Worldwide Leading Stars for Contemporary Fiction Movies (Rank 101-200) 159 $1,043,733,068
Top Worldwide Leading Stars for Science Fiction Movies (Rank 201-300) 276 $228,200,960
Top Worldwide Leading Stars for Kids Fiction Movies 21 $2,027,794,159
Top Worldwide Leading Stars for Super Hero Movies (Rank 201-300) 215 $229,155,503
Top Worldwide Leading Stars for Fantasy Movies (Rank 201-300) 284 $141,344,255
Top Worldwide Leading Stars for Dramatization Movies (Rank 201-300) 236 $90,072,190
Top Domestic Leading Stars for Adventure Movies 60 $741,989,569
Top Domestic Leading Stars for Action Movies (Rank 401-500) 451 $98,780,042
Top Domestic Leading Stars for Comedy Movies 23 $733,950,621
Top Domestic Leading Stars for Drama Movies (Rank 801-900) 867 $18,588,637
Top Domestic Leading Stars for Romantic Comedy Movies 43 $179,078,036
Top Domestic Leading Stars for Black Comedy Movies 71 $59,023,442
Top International Leading Stars for Adventure Movies 54 $1,285,804,590
Top International Leading Stars for Action Movies (Rank 501-600) 521 $130,375,461
Top International Leading Stars for Comedy Movies 78 $379,764,898
Top International Leading Stars for Drama Movies (Rank 601-700) 637 $29,672,308
Top International Leading Stars for Romantic Comedy Movies (Rank 101-200) 109 $93,812,340
Top International Leading Stars for Black Comedy Movies (Rank 201-300) 201 $9,460,191
Top Worldwide Leading Stars for Adventure Movies 49 $2,027,794,159
Top Worldwide Leading Stars for Action Movies (Rank 401-500) 494 $229,155,503
Top Worldwide Leading Stars for Comedy Movies 47 $1,113,715,519
Top Worldwide Leading Stars for Drama Movies (Rank 701-800) 765 $48,260,945
Top Worldwide Leading Stars for Romantic Comedy Movies 58 $272,890,376
Top Worldwide Leading Stars for Black Comedy Movies (Rank 101-200) 128 $68,483,633
Top Domestic Leading Stars for PG-13 Movies (Rank 601-700) 626 $153,263,202
Top Domestic Leading Stars for R Movies 22 $936,157,576
Top Domestic Leading Stars for PG Movies 48 $741,989,569
Top International Leading Stars for PG-13 Movies (Rank 601-700) 661 $161,415,495
Top International Leading Stars for R Movies (Rank 101-200) 103 $481,669,703
Top International Leading Stars for PG Movies 33 $1,285,804,590
Top Worldwide Leading Stars for PG-13 Movies (Rank 601-700) 655 $314,678,697
Top Worldwide Leading Stars for R Movies 36 $1,417,827,279
Top Worldwide Leading Stars for PG Movies 33 $2,027,794,159
Top Domestic Leading Stars for Walt Disney Movies (Rank 101-200) 101 $543,638,043
Top Domestic Leading Stars for Warner Bros. Movies (Rank 801-900) 858 $24,007,324
Top Domestic Leading Stars for Universal Movies 40 $460,806,230
Top Domestic Leading Stars for Sony Pictures Movies 34 $448,322,366
Top Domestic Leading Stars for Paramount Pictures Movies 99 $235,485,741
Top Domestic Leading Stars for Lionsgate Movies (Rank 301-400) 316 $30,316,271
Top International Leading Stars for Walt Disney Movies 66 $1,102,468,736
Top International Leading Stars for Warner Bros. Movies (Rank 801-900) 821 $3,141,574
Top International Leading Stars for Universal Movies (Rank 101-200) 107 $354,485,322
Top International Leading Stars for Sony Pictures Movies (Rank 101-200) 103 $233,988,169
Top International Leading Stars for Paramount Pictures Movies (Rank 101-200) 163 $187,943,956
Top International Leading Stars for Lionsgate Movies (Rank 301-400) 311 $23,308,153
Top Worldwide Leading Stars for Walt Disney Movies 72 $1,646,106,779
Top Worldwide Leading Stars for Warner Bros. Movies (Rank 801-900) 894 $27,148,898
Top Worldwide Leading Stars for Universal Movies 76 $815,291,552
Top Worldwide Leading Stars for Sony Pictures Movies 61 $682,310,535
Top Worldwide Leading Stars for Paramount Pictures Movies (Rank 101-200) 143 $423,429,697
Top Worldwide Leading Stars for Lionsgate Movies (Rank 301-400) 310 $53,624,424

All Technical Credits


Register with The Numbers for free to customize this chart.

Release
Date
TitleRoleDomestic
Box Office
International
Box Office
Worldwide
Box Office
Jan 26, 2024Miller’s Girl Producer $321,000$403,699$724,699
Aug 2, 2023Teenage Mutant Ninja Turtle… Producer $118,700,272$61,629,593$180,329,865
Jul 21, 2023Cobweb Producer $7,711,647$7,711,647
Jul 7, 2023Joy Ride Producer $12,897,789$2,620,847$15,518,636
Aug 6, 2020An American Pickle Producer $499,737$499,737
Aug 16, 2019Good Boys Producer $83,140,306$28,033,942$111,174,248
Apr 6, 2018Blockers Producer $60,311,495$34,212,286$94,523,781
Mar 23, 2018Game Over, Man! Producer
Dec 1, 2017The Disaster Artist Producer $21,120,616$7,597,051$28,717,667
Aug 12, 2016Sausage Party Screenwriter
Story by
Producer
$97,670,358$43,673,897$141,344,255
May 20, 2016Neighbors 2: Sorority Rising Screenwriter
Producer
$55,340,730$53,416,891$108,757,621
Nov 20, 2015The Night Before Producer $43,035,725$9,532,374$52,568,099
May 9, 2014Neighbors Producer $150,086,800$120,857,628$270,944,428
Feb 6, 2014The Interview Director
Story Creator
Producer
$6,105,175$6,237,457$12,342,632
Jun 12, 2013This is the End Director
Producer
Screenwriter
Story Creator
$101,470,202$25,068,915$126,539,117
Dec 19, 2012The Guilt Trip Executive Producer $37,134,215$4,608,102$41,742,317
Jul 27, 2012The Watch Screenwriter $34,353,000$32,777,045$67,130,045
Sep 30, 201150/50 Producer $35,016,118$6,318,617$41,334,735
Jan 14, 2011The Green Hornet Executive Producer
Screenwriter
$98,780,042$130,375,461$229,155,503
Jul 31, 2009Funny People Executive Producer $51,855,045$20,025,260$71,880,305
Aug 6, 2008Pineapple Express Screenwriter
Story Creator
Executive Producer
$87,341,380$15,062,639$102,404,019
Mar 21, 2008Drillbit Taylor Screenwriter
Story by
$32,862,104$16,824,159$49,686,263
Aug 17, 2007Superbad Screenwriter
Executive Producer
$121,463,226$48,491,916$169,955,142
Jun 1, 2007Knocked Up Executive Producer $148,761,765$70,504,187$219,265,952
Aug 19, 2005The 40 Year-old Virgin Co-Producer $109,449,237$66,827,602$176,276,839
 
Averages $68,509,845$33,887,956$96,688,648
Totals 25 $1,507,216,600$813,310,952$2,320,527,552


Director Credits


Register with The Numbers for free to customize this chart.

Release
Date
TitleOpening
Weekend
Maximum
Theaters
Domestic
Box Office
Worldwide
Box Office
Domestic
Share
Feb 6, 2014The Interview 581$6,105,175$12,342,63249.5%
Jun 12, 2013This is the End $20,719,1623,055$101,470,202$126,539,11780.2%
 
Averages $20,719,1621,818$53,787,689$69,440,87564.8%
Totals 2 $107,575,377$138,881,749


Producer Credits


Register with The Numbers for free to customize this chart.

Release
Date
TitleOpening
Weekend
Maximum
Theaters
Domestic
Box Office
Worldwide
Box Office
Domestic
Share
Jan 26, 2024Miller’s Girl $321,000350$321,000$724,69944.3%
Aug 2, 2023Teenage Mutant Ninja T… $28,007,5443,950$118,700,272$180,329,86565.8%
Jul 21, 2023Cobweb $7,711,647
Jul 7, 2023Joy Ride $5,806,2772,820$12,897,789$15,518,63683.1%
Aug 6, 2020An American Pickle $499,737
Aug 16, 2019Good Boys $21,402,6053,458$83,140,306$111,174,24874.8%
Apr 6, 2018Blockers $20,556,3503,418$60,311,495$94,523,78163.8%
Mar 23, 2018Game Over, Man!
Dec 1, 2017The Disaster Artist $1,211,3451,010$21,120,616$28,717,66773.5%
Aug 12, 2016Sausage Party $34,263,5343,135$97,670,358$141,344,25569.1%
May 20, 2016Neighbors 2: Sorority … $21,760,4053,416$55,340,730$108,757,62150.9%
Nov 20, 2015The Night Before $9,880,5362,960$43,035,725$52,568,09981.9%
May 9, 2014Neighbors $49,033,9153,311$150,086,800$270,944,42855.4%
Feb 6, 2014The Interview 581$6,105,175$12,342,63249.5%
Jun 12, 2013This is the End $20,719,1623,055$101,470,202$126,539,11780.2%
Sep 30, 201150/50 $8,644,0952,479$35,016,118$41,334,73584.7%
 
Averages $18,467,2312,611$60,401,276$79,535,41167.5%
Totals 16 $785,216,586$1,193,031,167


Writer Credits


Register with The Numbers for free to customize this chart.

Release
Date
TitleOpening
Weekend
Maximum
Theaters
Domestic
Box Office
Worldwide
Box Office
Domestic
Share
Aug 12, 2016Sausage Party $34,263,5343,135$97,670,358$141,344,25569.1%
May 20, 2016Neighbors 2: Sorority … $21,760,4053,416$55,340,730$108,757,62150.9%
Feb 6, 2014The Interview 581$6,105,175$12,342,63249.5%
Jun 12, 2013This is the End $20,719,1623,055$101,470,202$126,539,11780.2%
Jul 27, 2012The Watch $12,750,2973,168$34,353,000$67,130,04551.2%
Jan 14, 2011The Green Hornet $33,526,8763,584$98,780,042$229,155,50343.1%
Aug 6, 2008Pineapple Express $23,245,0253,072$87,341,380$102,404,01985.3%
Mar 21, 2008Drillbit Taylor $10,309,9863,061$32,862,104$49,686,26366.1%
Aug 17, 2007Superbad $33,052,4113,069$121,463,226$169,955,14271.5%
 
Averages $23,703,4622,905$70,598,469$111,923,84463.0%
Totals 9 $635,386,217$1,007,314,597

Latest Ranking on All Technical Box Office Record Lists


RecordRankAmount
Top Grossing Co-Producer at the Domestic Box Office (Rank 401-500) 457 $109,449,237
Top Grossing Director at the Domestic Box Office (Rank 601-700) 671 $107,575,377
Top Grossing Executive Producer at the Domestic Box Office (Rank 201-300) 247 $545,335,673
Top Grossing Producer at the Domestic Box Office (Rank 101-200) 177 $785,216,586
Top Grossing Screenwriter at the Domestic Box Office (Rank 101-200) 156 $629,281,042
Top Grossing Story Creator at the Domestic Box Office (Rank 101-200) 153 $325,449,219
Top Grossing Co-Producer at the International Box Office (Rank 601-700) 695 $66,827,602
Top Grossing Director at the International Box Office (Rank 1,401-1,500) 1,500 $31,306,372
Top Grossing Executive Producer at the International Box Office (Rank 601-700) 663 $289,067,565
Top Grossing Producer at the International Box Office (Rank 401-500) 461 $407,805,291
Top Grossing Screenwriter at the International Box Office (Rank 401-500) 461 $365,690,923
Top Grossing Story Creator at the International Box Office (Rank 701-800) 745 $106,867,067
Top Grossing Co-Producer at the Worldwide Box Office (Rank 501-600) 561 $176,276,839
Top Grossing Director at the Worldwide Box Office (Rank 901-1,000) 923 $138,881,749
Top Grossing Executive Producer at the Worldwide Box Office (Rank 301-400) 398 $834,403,238
Top Grossing Producer at the Worldwide Box Office (Rank 201-300) 279 $1,193,021,877
Top Grossing Screenwriter at the Worldwide Box Office (Rank 201-300) 251 $994,971,965
Top Grossing Story Creator at the Worldwide Box Office (Rank 301-400) 332 $432,316,286