December 12th, 2013
The winners of our Out of the Fire contest were determined and they are...
More...
December 6th, 2013
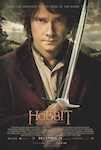
Next week there are two wide releases, The Hobbit: The Desolation of Smaug and Tyler Perry's A Madea Christmas. The Desolation of Smaug is clearly going to be the winner and it is the only real choice for the target film for this week's box office prediction contest. In order to win, one must simply predict the opening weekend box office number for The Hobbit: The Desolation of Smaug.
On the other hand, there's no clear prize for this week's winner. We have something a little different this time around. Whoever comes the closest to predicting the film's opening 3-day weekend box office (Friday to Sunday), regardless if they go over or not, will win a random Blu-ray from the following list...
Just look at the app...
There are 21 possibly Blu-rays on that list, and the winner won't know which one they won till it arrives. I think this is kind of fun.
Entries must be received by 10 a.m., Pacific Time on Friday to be eligible, so don't delay!
More...
November 29th, 2013
Next weekend is the weekend after Thanksgiving day, and like it is nearly every year, it's a really weak week for new releases. In fact, there's only one film that might open wide, Out of the Furnace, and I'm not 100% sure it will. Additionally, it is opening on the Wednesday, while we only look at the Friday through Sunday numbers. Regardless, we need a target film for our box office prediction contest and this is the only choice. In order to win, one must simply predict the opening weekend box office number for Out of the Furnace.
Whoever comes the closest to predicting the film's opening 3-day weekend box office (Friday to Sunday), without going over, will win a copy of Rise of the Guardians Holiday Edition with Marching Elf on DVD.
Meanwhile, whoever comes the closest to predicting the film's opening 3-day weekend box office (Friday to Sunday), without going under, will win a copy of Kung Fu Panda: Legends of Awesomeness - Good Croc, Bad Croc on DVD.
Entries must be received by 10 a.m., Pacific Time on Friday to be eligible, so don't delay!
More...
May 19th, 2013
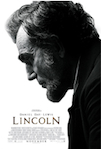
The week of March 31st, 2013 was a strange week on the home market, as it contained Easter weekend. Easter sales helped a lot of older releases rise on the DVD sales chart. Even so, a new release, Lincoln, led the way with 818,000 units / $15.62 million.
More...
May 9th, 2013
The Hobbit: An Unexpected Journey was one of three new releases to finish in the top three spots on the March 24th, 2013 edition of the Blu-ray sales chart. It sold 1.36 million units and generated $31.34 million for an opening week Blu-ray share of 56%. It wasn't that long ago that reaching the 50% mark would have been record-breaking, but here it was expected.
More...
May 9th, 2013
The Hobbit: An Unexpected Journey dominated the new releases and easily won first place on the March 24th edition of the DVD sales chart. The film sold 1.07 million units and generated $13.05 million in opening week sales, putting it in the top ten of the year after just one week of release.
More...
April 29th, 2013
While there were lots of new releases boosting the Blu-ray sales chart, including top ranked Rise of the Guardians, it wasn't enough to keep the Blu-ray ahead in the week-over-week comparison. Granted, it only declined 12% in terms of units and 21% in terms of revenue, which isn't too bad. Year-over-year, Blu-ray sales skyrocketed up 102% in terms of units and 79% in terms of revenue, which is fantastic. The overall Blu-ray share was again very strong at 36% in terms of units and 44% in terms of revenue.
More...
April 29th, 2013
New releases did better on Blu-ray than they did on DVD with eight films charting on the March 17th, 2013 edition of the Blu-ray sales chart. They were led by Rise of the Guardians, which sold 584,000 units / $11.77 million. Its opening week Blu-ray share was 42%, which is strong, for a kids movie.
More...
April 29th, 2013
There were not a lot of new releases on the March 17th, 2013 edition of the DVD sales chart, but one of them took top spot. Rise of the Guardians sold 804,000 units and generated $12.45 million in sales. This is a solid opening for this type of release.
More...
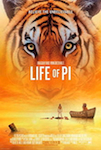
March 13th, 2013
There are not many first run releases coming out on the home market this week, but two of them, Life of Pi and Rise of the Guardians, rose to Pick of the Week status. For that honor, we have to turn to an older release, Who Framed Roger Rabbit?, which celebrated its 25th Anniversary by coming out on Blu-ray for the first time. Yes, it is shovelware, but it is still the best movie on this week's list. If you don't have the DVD already and really don't like Pan & Scan, you might want to wait till Disney fixes the mix-up with the DVD portion of the Combo Pack.
More...
March 12th, 2013
Rise of the Guardians is a family friendly film that came out right around Thanksgiving. That's a recipe for box office success. It didn't bomb, but it also didn't live up to expectations, while it will need a little help from the home market to break even. Did it struggle for a reason? Or will the Blu-ray sales push it over the top into profitability?
More...
January 28th, 2013
January ended, and we should all be glad it did. Hansel and Gretel: Witch Hunters did beat modest expectations, but most of the rest failed that test with Movie 43 crashing worse than even my low expectations. The overall box office fell 20% from last weekend to $112 million. This was 11% less than the same weekend last year; fortunately, this was the first miss of 2013 and the year still has a lead of 10% over 2012 at $797 million to $721 million.
More...
January 10th, 2013
Life of Pi rose to first place with $59.30 million on 10,027 screens in 64 markets for a total of $302.04 million internationally and $393.08 million worldwide. The film reportedly dominated the Russian box office with $14.2 million on 1,600 screens. It had to settle for second place in Australia with $5.18 million on 545 screens over the weekend for a total of $8.36 million. It managed third place in South Korea with $3.06 million on 392 screens over the weekend for a total opening of $5.35 million. This film has yet to open in Japan and a few smaller markets, so it isn't done yet and it should have no trouble getting to $500 million worldwide.
More...
January 6th, 2013
Producers Guild of America announced their nominations this week, including the three theatrical categories. There were a number of films on the list that have been mentioned time and time again this awards season, like Zero Dark Thirty, but there were also a few surprises.
More...
December 27th, 2012
The Hobbit: An Unexpected Journey remained on top of the international chart with an estimated $96 million on 18,417 screens in 59 markets for a total of $288.5 million. This includes a first place, $17.8 million opening on 2,115 screens in Russia. It also had an amazing hold in Germany down just 6% to $14.2 million on 1,408 screens over the weekend for a total of $36.7 million after two. The film's best market remained the U.K. where it has made $38.4 million, including $9.8 million on 1,546 screens this past weekend, but that is a pretty steep drop-off.
More...
December 27th, 2012
This year, Christmas fell on a really awkward day and compounded with the smart decision for some studios to close the entire week, dealing with the weekend box office numbers is a little trickier this year. We are still stuck with a mixture of final numbers and studio estimates, but since we won't get absolute final numbers till likely January 2nd, we should at least talk about the numbers we have. We won't be able to compare the full weekend to last week or last year, because we don't have the full weekend numbers. But since most of the films failed to match expectations, things look grim.
More...
December 20th, 2012
The Hobbit: An Unexpected Journey entered the international chart in first place with $138.0 million on 18,165 screens in 56 markets. Leading the way was the U.K. with $18.80 million on 598 screens, while it also cracked $10 million in Germany with $15.13 million on 877 screens over the weekend for a total opening of $17.19 million. It also came very close in France with $9.77 million on 958 screens. The film had similar strong openings in Spain with $7.98 million on 1,052 screens and in South Korea with $7.29 million on 1,028 screes over the weekend, although it had a total opening of $8.50 million.
More...
December 17th, 2012
In a result that surprised absolutely no one, The Hobbit: An Unexpected Journey earned first place on top of the chart this weekend. It earned more than the entire box office earned last weekend leading to a 70% increase week-over-week to $136 million. Compared to last year, the box office was 15% higher, as The Hobbit made more than last year's three wide releases opened with combined. Year-to-date, 2012 has earned $10.19 billion, which is 6.1% higher than last year's pace. Additionally, the year is about $100 million away from topping 2011's final tally. It should have no trouble surpassing that total some time over the weekend. On the other hand, it is still far behind the record set by 2009.
More...
December 13th, 2012
The Hobbit: An Unexpected Journey opens this weekend and it will clearly be the biggest hit of the month and likely the biggest hit of the winter. There is roughly a 100% chance that The Hobbit will earn first place and nearly all analysts think it will earn more than the entire box office earned last week. It might even earn more than the entire box office made last year. Last year, the box office was led by Sherlock Holmes: A Game of Shadows, which made just under $40 million, while second place went to Alvin and the Chipmunks: Chip-Wrecked with just over $23 million. If The Hobbit doesn't make more than those two films made combined, then the box office is in serious trouble.
More...
December 13th, 2012
The Hollywood Foreign Press Association announced their nominations and the same list of films that have been mentioned since the beginning of Awards Season were rewarded today. Lincoln led the way with seven nods, while Argo and Django Unchained were close behind with five.
More...
December 13th, 2012
Rise Of The Guardians reached first place on the international chart with $26.71 million on 9,620 screens in 58 markets for a total of $91.33 million. The film had no major market openings, but it did rise to first place in the U.K. with $2.57 million on 495 screens over the weekend for a total of $6.51 million after two. It also remained in first place in France with $2.86 million on 649 screens, giving it a two-week total of $7.79 million. The film does have a few more markets left to open in, including Australia this coming weekend, so it should earn enough to break even sooner rather than later.
More...
December 10th, 2012
Skyfall returned to the top of the box office chart, which is fitting, because it was the last film released that truly beat expectations at the box office. The only wide release this week, Playing For Keeps, barely remained above the Mendoza Line and failed to reach the top five. The overall box office fell 30% to just $80 million. Ugh. There are a couple of pieces of good news we should focus on. Firstly, $80 million is still 7% higher than this weekend last year. Secondly, it was enough to push 2012 over the $10 billion market. At the moment, the total box office for 2012 is $10.02 billion, which is 6% higher than 2011 had managed at the same point in the year. By this time next week, 2012 might be ahead of 2011's final figure of $10.28 billion.
More...
December 7th, 2012
For the third weekend in a row, holdovers are expected to dominated the box office. In fact, there are many analysts that think Playing For Keeps won't even reach the top five. That doesn't mean there won't be a race for top spot, as Skyfall, Lincoln, and The Twilight Saga: Breaking Dawn, Part 2 were within $100,000 of each other on Wednesday. Will Lincoln finally gets its place at the top? Or will Skyfall return to the clouds? Meanwhile, how will the overall box office compare to last year, which was led by the one-two punch of New Year's Eve and The Sitter. That was a pretty weak effort from 2011, so 2012 does have an opening for a victory, despite the lack of significant new releases.
More...
December 6th, 2012
We are still stuck with studio estimates for the international numbers, but we can confidently say The Twilight Saga: Breaking Dawn, Part 2 is in top spot. The film pulled in $48.8 million on 11,800 screens in 73 markets for totals of $447.8 million internationally and $702.40 million worldwide. It has likely already become the biggest hit in the franchise. The film had no major market openings, but it has yet to debut in Japan, but it will likely get past $800 million before then, which will be its last major milestone.
More...
December 3rd, 2012
It was a close race for top spot as The Twilight Saga: Breaking Dawn, Part 2 just held off Skyfall by less than $1 million. Unfortunately, the best new release, Killing Them Softly, failed to match low expectations, while The Collection barely managed a spot in the top ten. The overall box office fell 45% to $114 million. However, as sharp as that decline was, it was still 41% higher than the same weekend last year and December begins with 2012 ahead of 2011 by 5.9% at $9.91 billion to $9.36 billion.
More...
November 30th, 2012
Like last weekend, holdovers will again dominate the new releases this weekend. However, one could argue the headline is inaccurate, as Killing Them Softly is really the only new film opening truly wide, so it should be "release", singular. The Collection is opening in more theaters than originally anticipated, perhaps enough to grab a spot in the top ten, but it is not opening truly wide. That said, there are some who think The Twilight Saga: Breaking Dawn, Part 2 will relinquish top spot at the box office with some thinking Skyfall will regain the title, while others think Lincoln will climb to first place. This weekend last year was a total disaster with the best new release playing in just 10 theaters. This year we should be a little stronger at the top and with a lot more depth.
More...
November 29th, 2012
The Twilight Saga: Breaking Dawn, Part 2 held firm in first place with $104.21 million on 12,818 screens in 73 markets for a two-week total of $365.46 million intentionally and $592.83 million worldwide. By this time next week, it should be the biggest hit in the franchise. This past weekend, the film opened in Germany earning first place with $12.82 million on 765 screens for a total opening of $16.67 million. Its best holdover was in the U.K. where it made $8.56 million on 559 screens over the weekend for a total of $43.22 million. This is a strong result, but it was down 66%, which is troubling. It was better in Russia down 62% to $8.30 million on 1,380 screens for a total of $36.28 million after two. A 62% decline is actually average for the market, more or less. The film has very few markets left to open in, but it is already profitable, so the studio should be very happy.
More...
November 28th, 2012
The winners of our Bedeviled and Befuddled contest were determined and they are...
More...
November 26th, 2012
The Thanksgiving long weekend was stronger than anticipated with nearly every film topping predictions, some by pretty big margins. In fact, some earned more over three days than they were expected to earn over five days. Despite this, the box office was actually down 17% from last weekend to $208 million over the three-day portion of the weekend. This was 26% higher than the three-day portion of last year's Thanksgiving long weekend. Over five days, the box office pulled in $291 million, which is the most ever for a Thanksgiving weekend and 25% higher than last year. Year-to-date, 2012 has pulled in $9.75 billion, which is 5.5% higher than last year's running tally of $9.24 billion. If 2012 can simply match 2011 the rest of the way, then we will set a new all-time yearly box office total with about $10.7 billion.
More...
November 25th, 2012
As expected, The Twilight Saga: Breaking Dawn, Part 2 and Skyfall are dominating the Thanksgiving charts, and, with some help from three new releases and two strong holdovers, will produce the most lucrative Thanksgiving holiday in history. All told, we should see something a little over $200 million in revenue for the three-day portion of the weekend, placing it in the top 20 weekends of all time. Breaking Dawn, Part 2 is tracking about in line with Part 1 at this point in its run. In contrast, Skyfall is well ahead of James Bond's previous outing, and has become the first Bond movie to top $200 million domestically (before adjusting for inflation).
More...
November 21st, 2012
It's the beginning of Thanksgiving long weekend tonight, which means it is a busy day for new releases. There are three new releases opening wide, plus another film that is expanding wide enough that is has a shot at the top ten. Unfortunately for the new films, there's little hope any of them will top The Twilight Saga: Breaking Dawn, Part 2 over the weekend. In fact, there's a chance none of them will top Skyfall for second place. Rise of the Guardians is the only one with a real shot at second place, while Life of Pi and Red Dawn will be in a tough battle for fifth place. Finally, Silver Linings Playbook is expanding to more than 400 theaters and could grab tenth place. The box office last year looks very similar to the box office potential this year. With a little luck, there will be mostly pleasant surprises rather than serious disappointments and 2012 will have another solid win.
More...
November 16th, 2012

Next week is Thanksgiving long weekend, which makes things a little more confusing than usual on our weekly Box Office Prediction Contest. There are three wide releases coming out, but they all debut on Wednesday rather than Friday. (Although we still are only concerned with the Friday through Sunday numbers.) Of the three films, Life of Pi is earning the best reviews of the weekend, but it's only hope to be a $100 million hit is if it earns enough Awards Season buzz to still be in semi-wide release in January. It certainly won't have a monster opening. The oft-delayed Red Dawn finally comes out, but the buzz is just as weak as its early reviews. This leaves Rise of The Guardians as the only real choice for the target film in this week's box office prediction contest. In order to win, one must simply predict the opening weekend box office number for Rise of The Guardians.
Whoever comes the closest to predicting the film's opening 3-day weekend box office (Friday to Sunday), without going over, will win a copy of Bedeviled on Blu-ray.
Meanwhile, whoever comes the closest to predicting the film's opening 3-day weekend box office (Friday to Sunday), without going under, will win a copy of Fire with Fire on DVD.
Entries must be received by 10 a.m., Pacific Time on Friday to be eligible, so don't delay!
More...
November 1st, 2012
October was pretty good with a few films really crushing expectations, which made up for the few duds that opened at the end. 2012 gained about $100 million over 2011 during the month of October. We really needed this success and hopefully November will continue this push forward. However, November is a bit of a weird month. There are five weekends, but only eight true wide releases, half of which open on the Thanksgiving long weekend, leaving the other four weeks with just one true wide release each. There are a couple others opening in the semi-wide level and another opening in limited release with a planned wide release, but even so, it is not a busy month. That said, it is a case of quality over quantity. There are four films that are pretty much guaranteed to reach $100 million, one of which should reach $300 million. By comparison, last November only produced one $100 million film. Granted, that film was The Twilight Saga: Breaking Dawn, Part 1, which made nearly $300 million, which is a huge number no matter how you look at it. But this year, The Twilight Saga: Breaking Dawn, Part 2 should top that number and with the other $100 million movies pulling in more than $400 million combined, it should be a very profitable month at the box office.
More...