November 8th, 2016
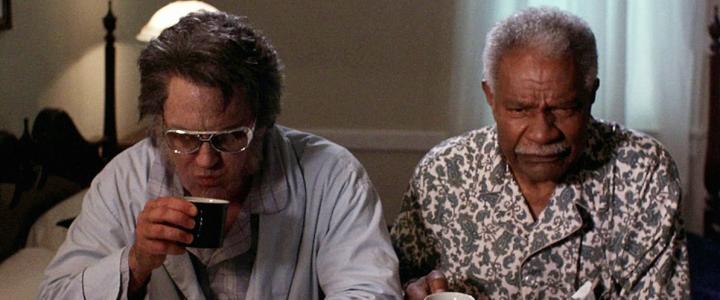
It’s not a particularly deep week for new releases. A lot of releases on this week’s list were good, but not good enough to be a contender for Pick of the Week, like Daredevil: The Complete First Season on Blu-ray. I reviewed Finding Dory this weekend, but I have already named it Pick of the Week. So the only real contender was Bubba Ho-Tep: Collector’s Edition.
More...
November 2nd, 2016

The Home Market Release Report is a day late this week for a trio of reasons. Firstly, the November Preview was also due the same day. Secondly, it was a very busy week. And finally, I’m suffering from a medical condition a lot of Canadians suffer from this time of year... acute Coffee Crisp poisoning. I’m not saying I ate four dozen fun-sized Coffee Crisps in the past three days... I’m not saying that, because it was actually an even 50. Don’t judge me. ... Okay, judge me. Clearly mistakes were made. It is a busy week, but not very deep week. Star Trek Beyond is by far the biggest and best release of the week and the various home market releases are the pick of the week. There wasn’t a lot of competition for that title, but Bad Moms is also worth picking up.
More...
September 7th, 2016
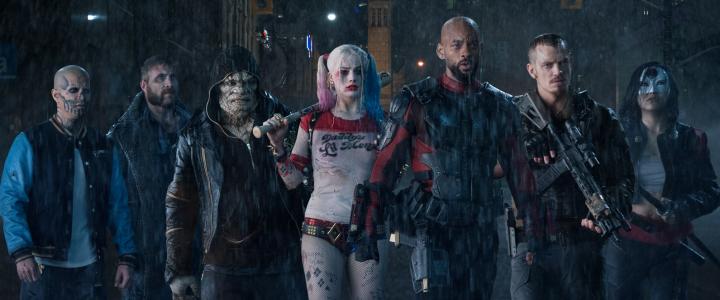
The Labor Day long weekend wasn’t even close with Don’t Breathe earning more over three days than any other film earned over four. There were a couple of other major stories as Suicide Squad hit $300 million on Monday and Bad Moms hit $100 million on Saturday. Given the production budgets of those two films, the latter has a lot more reasons to celebrate. As for the new releases, the studios will just be hoping no one remembers them in a few weeks. The Light Between Oceans missed the top five, while Morgan missed the top ten. The overall box office fell 16% to $99 million over the three-day weekend and $127 million including Monday. This is 8.9% higher than the same weekend last year. Year-to-date, 2016’s lead over 2015 grew to $500 million at $7.98 billion to $7.48 billion. That’s a lead of 6.7%. It would take a real collapse for 2016 to lose at this rate.
More...
August 29th, 2016

Don’t Breathe topped the weekend box office chart earning $26.41 million. This was double its nearest competitor, Suicide Squad, and more than three times the other new release, Mechanic: Resurrection. The overall box office fell 12% from last weekend to $117 million. This is 33% higher than this weekend last year, which is really impressive for a year-over-year comparison. Year-to-date, 2016’s lead over 2015 has grown to $480 million or 6.5% at $7.81 billion to $7.33 billion.
More...
August 28th, 2016
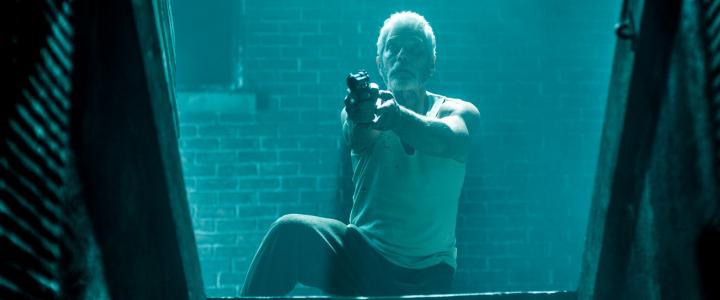
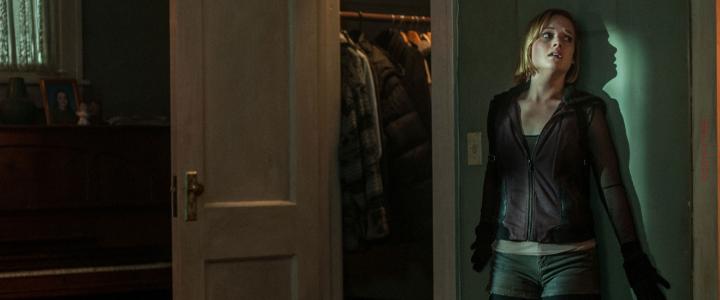
Fall season begins in earnest this weekend with the low-budget suspense flick Don’t Breathe taking over at the top of the box office chart. Sony is predicting a $26.1 million debut for the film, which will be the best debut for a horror or suspense film since The Purge: Election Year’s $31.5 million in July, and the best for a non-sequel since Annabelle’s $37.1 million in October, 2014. Don’t Breathe has the advantage of really good reviews (currently running at 84% positive on Rotten Tomatoes), although it will have a lot of competition over the next few weeks, with films aimed at a broadly similar audience coming out every week for the next three weeks (not to mention a truckload more arriving in October).
More...
August 27th, 2016
Don’t Breathe earned a stunning $10.02 million on Friday, which isn’t that much less than some people predicted it would earn over the entire weekend. Its reviews are among the best of any wide release to come out this year. Its CinemaScore was a B+, which is better than most horror films manage. (Like I’ve said in the past, there are two schools of horror fans: gorehounds and those who demand high tension. It is nearly impossible to appeal to both groups, so these movies have a hard time doing well in this metric.) Horror films tend to have a low internal multiplier, but the film is still on pace for $23 million, which is ahead of predictions.
More...
August 25th, 2016
It’s the last weekend of summer and a number of schools are already back, so the box office prospects are really low. That’s not to say there’s nothing to look forward to, as Don’t Breathe is earning stellar reviews. On the other hand, Mechanic: Resurrection still has no reviews. (There was another movie, Hands of Stone, that was expected to open wide, but that is no longer the case.) This weekend last year, Straight Outta Compton completed its threepete with $13.13 million. The best new release was War Room, which only managed $11.35 million. This year, the two wide releases will topped the combined numbers of those two films, while the holdovers will push 2016 over 2015 in the year-over-year comparison.
More...
August 21st, 2016

Three even-matched debutants proved to be no match for the incumbents at the box office this weekend, with Suicide Squad taking a third straight victory at the box office with $20.71 million, according to Warner Bros.’ Sunday morning projection. Sausage Party stays in second with $15.3 million, and that leaves the new entrants in 3rd, 4th and 5th. This was a weekend where diversity isn’t the problem, but novelty is.
More...
August 20th, 2016

Suicide Squad led the way on Friday with $6.03 million. This is almost perfectly in line with predictions and it should finish with just a little above $20 million over the weekend.
More...
August 18th, 2016
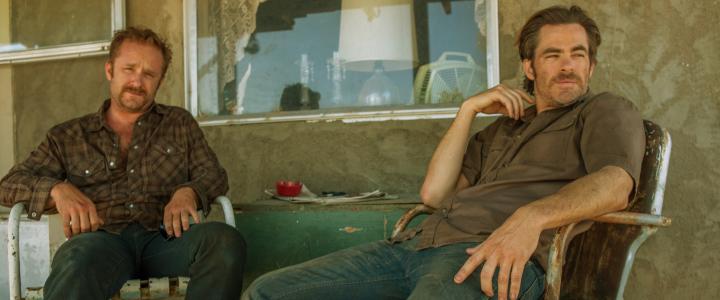
Summer is over, at least as far as the box office is concerned. There are three films opening wide and another expanding wide-ish, but none of them are expected to crack $20 million over the weekend. War Dogs should come the closest, but even then, it is only aiming at the midteens. Kubo and the Two Strings is the best of the new releases, but recent history isn’t kind to stop-motion animated films. The final wide release of the week is Ben-Hur. This film cost nearly $100 million to make and it is expected to bomb spectacularly. Hell or High Water is expected to expand semi-wide, perhaps wide enough to score a spot in the top ten. Suicide Squad will likely win the box office race, but this has less to do with the film’s strength and more to do with the weak competition. Speaking of weak competition, this weekend last year, Straight Outta Compton earned more than all three wide releases combined. 2016 won’t be able to match it at the top of the chart, but there’s much better depth this year than last year, so 2016 should win in the year-over-year comparison.
More...
August 16th, 2016
Hell or High Water led the way on the Theater Average Chart with an average of $19,417 in 32 theaters. The studio was hoping for only half of that, so this is a fantastic start. The biggest new release of the week, Sausage Party, was next with an average of $11,042, while the overall number one film, Suicide Squad, was right behind with $10,232.
More...
August 16th, 2016

The overall box office was a little weaker than expected with Suicide Squad falling nearly as fast as Batman v Superman: Dawn of Justice did. On the other hand, Sausage Party opened better than expected earning a solid second place. Overall, the box office pulled in $172 million over the weekend, which is 25% smaller than last weekend. Compared to the same weekend last year, the box office was 16% higher and that’s the most important number. Year-to-date, 2016 has pulled in $7.43 billion, putting it 5.3% ahead of last year’s pace. The box office just needs to maintain its $380 million lead throughout the rest of the summer to be considered a success.
More...
August 14th, 2016

A precipitous drop from last weekend won’t be enough to knock Suicide Squad off its perch at the top of the box office chart, according to studio estimates released on Friday. But a 67% fall is steep, even by modern standards. On the bright side, it is less than Batman v Superman’s 69% decline in its second weekend earlier this year, at least according to the estimates. A weak Sunday would put the two films basically neck-and-neck on that front, and it looks increasingly likely that Suicide Squad will end with less than $300 million domestically.
More...
August 13th, 2016
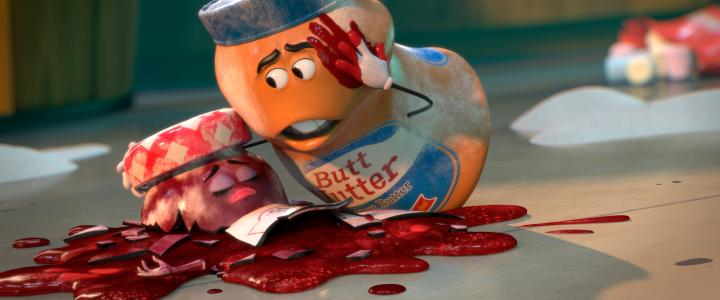
Sausage Party actually earned first place on Friday with $13.5 million, putting it just ahead of Suicide Squad. That lead won’t last, as new releases almost never has an internal multiplier as big as holdovers do. The film does have excellent reviews, but only earned a B CinemaScore. This could mean critics liked the film more than its target audience and it will have short legs. Or it could mean it is a more niche market release and it will be a cult classic in a few years. Regardless, a $33 million opening is in the works, which is excellent for a film that cost $19 million to make.
More...
August 12th, 2016

Sausage Party got off to a fast start with $3.25 million in previews. By comparison, Bad Moms earned $2 million during its previews two weeks ago, on its way to a $23.82 million opening weekend. If the two films had the same legs for their opening weekends, then we would be looking at a $38 million debut. Sausage Party does have better reviews that Bad Moms earned, but Bad Moms is aimed at a female demographic and generally speaking, women are less likely to rush out to see a movie during previews. So I think it is wise to be a little more cautious, but an opening weekend of over $30 million is still reason to celebrate.
More...
August 11th, 2016
Before we talk about the weekend predictions... If you can read this, it means my transfer worked well enough and I can do work from my parents house while pet-sitting. I will be at my parents place for three weeks looking after their dog and cat. I was at their house for less than 30 minutes before stepping into a puddle of dog drool. It is going to be a very long three weeks. ... As for the releases for the week, they are all amazing. The film earning the weakest reviews at the moment is Sausage Party, which is earning 82% positive reviews. 82% positive is the weakest of the three wide releases. That's amazing. On the other hand, it won't be the biggest release of the week. Pete’s Dragon has a better than 50/50 chance at reaching $100 million in total; however, as a family film, it will start relatively slow, but have good legs. Finally, there’s Florence Foster Jenkins, which is an early Oscar contender. It is not opening in a lot of theaters, so it is going to need great word-of-mouth to thrive. None of these new releases will match last year’s number one film, Straight Outta Compton, so it will be up to Suicide Squad to keep 2016 on the winning track. I think it will collapse by more than 60%, but 2016 has a lot better depth than 2015 and it will come out on top.
More...
August 5th, 2016
-1-News.jpg)
Next week is likely going to be the last weekend of summer, as Pete’s Dragon is the last film coming out this summer with a realistic shot at $100 million at the box office. The other two releases, Florence Foster Jenkins and Sausage Party, are pure counter-programming. If they make $100 million combined, then at least one of them will be seen as a success. Pete’s Dragon might not earn first place over the weekend, but it is the only real choice for the target film in this week's Box Office Prediction contest. In order to win, one must simply predict the opening weekend box office number for Pete’s Dragon.
Whoever comes the closest to predicting the film's opening 3-day weekend box office (Friday to Sunday), without going over, will win a Frankenprize consisting of a full-season TV on DVD release, two previously reviewed movies, or three single-disc kids DVDs.
Whoever comes the closest to predicting the film's opening 3-day weekend box office (Friday to Sunday), without going under, will also win a Frankenprize, as described above.
Finally, we will be choosing an entrant from the group of people who haven't won, or haven't won recently, and they will win the third Frankenprize, as described above.
Entries must be received by 10 a.m., Pacific Time on Friday to be eligible, so don't delay!
More...
August 1st, 2016
July did reasonably well, thanks mostly to The Secret Life of Pets, which will top $300 million shortly and could earn double its nearest competitor when all is said and done. That said, there were also a quartet of $100 million hits as well, so the month had good depth as well. August isn’t as lucky. There is one film that is expected to earn $100 million during its opening weekend, Suicide Squad, and one more that is expected to reach $100 million in total, Pete’s Dragon. There could be a surprise hit among the rest of the releases, (my long shot with a shot is Sausage Party) but for the most part, the rest of the wide releases would be happy with just $50 million at the box office. Last August was a disaster and Straight Outta Compton was the only hit of the month. Unless Suicide Squad bombs compared to expectations, 2016 will come out ahead in the year-over-year comparison.
More...