Analysis: average theatrical movie ticket prices in 2020, 2021 and 2022
March 16, 2023
From 1989 to 2019, the National Association of Theater Owners (NATO) published an estimate of the average price of a movie ticket in North America on an annual and quarterly basis. Their number was a widely used benchmark used to measure ticket price inflation over the years and convert box office dollars into estimated ticket sales. NATO, understandably, stopped releasing their estimate in 2020 when the pandemic shut down theaters and the organization hasn’t started doing so again (so far). That has left us, and many others in the industry, with an inconvenient hole in our reporting that we’re filling today with an analysis of publicly-available data on ticket prices before, during, and after the pandemic, and new estimates for quarterly ticket prices through 2022. Spoiler alert: ticket price inflation is real.
To construct the estimate, we collected average ticket prices reported in their quarterly and annual reports by three major chains: AMC, Cinemark, and Cineplex. Combining those public figures with NATO’s estimate for the quarter, we built a linear regression model that predicts what NATO’s estimate would be given the figures reported by the theater chains.
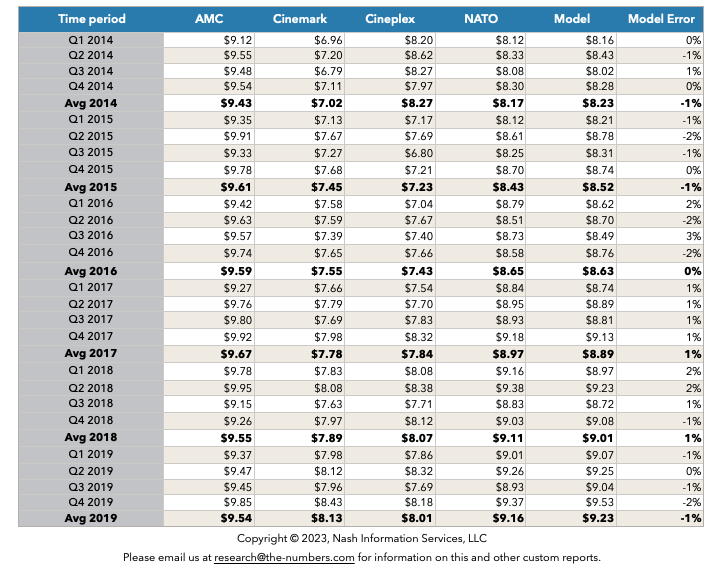
Here’s our full table of data with the averages reported by the chains, NATO’s quarterly estimate, and what our model predicts NATO’s reported average ticket price would be. Finally, the Model Error column shows the percentage difference between our model and NATO’s number.
Average ticket price data was gathered from the quarterly and annual reports from Cinemark Holdings, Inc; AMC Entertainment Holdings, Inc, and Cineplex Inc. Prices for Cineplex Inc, are originally reported in Canadian dollars; for our model, we use average quarter and annual exchange rate data to adjust their prices into US dollars.
Note: Quarterly and annual prices may be revised by the companies in later reports. We used the most recent reported price for each time period in the analysis.
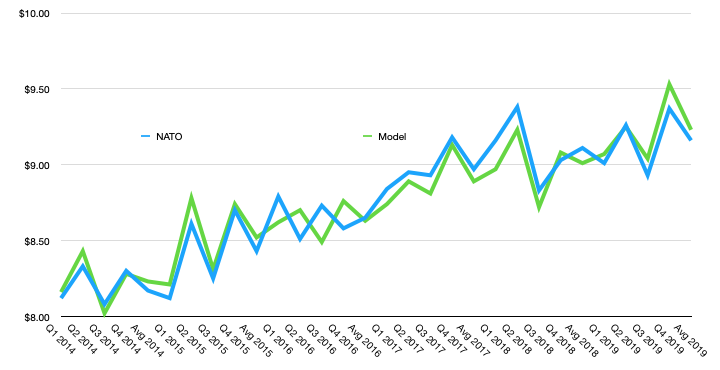
As the chart below shows, the model does a very good job of predicting NATO’s average ticket price estimate each quarter. The worst quarterly error was 3% ($0.24) in Q3, 2016, and the annual average ticket price prediction is within 10 cents of NATO’s number in all six years.
The precise parameters produced by the model are as follows:
Our results suggest that our model explains 91% of the observed variation in historical data.
One curiosity of the model is that there is a much higher coefficient from Cinemark in comparison to AMC and Cineplex. Given that AMC operated 600 locations as of March, 2022 (see NATO’s list of the largest domestic chains), compared to Cinemark’s 323 and Cineplex’s 164, one might expect AMC to dominate the average. It’s hard to be certain why the numbers work out like they do, but one possibility is that Cinemark’s theaters are more representative of the market as a whole, so their average ticket price tracks more closely with the market average.
Since the theater chains have continued to report average ticket prices (with one missing quarter for AMC and Cinemark) through 2020, 2021 and 2022, we can use our model to estimate the average ticket price by quarter over the past three years:
For the second quarter of 2020, most theaters were closed in North America, and AMC and Cinemark did not report any revenue or attendance during this period. For this reason, we used a different approach with the data available from Cineplex using the following formula:
Est. Q2, 2020 ticket price = NATO Q2, 2019 estimate x (Cineplex Q2, 2020/Cineplex Q2, 2019)
It’s fair to say that’s just a rule of thumb but gives us a complete dataset. Of course, with virtually no box office reported during that quarter, whatever number we use doesn’t have a major bearing on ticket sales estimates and the like. For the visually inclined, here’s the chart of NATO’s and our model’s estimated North American average ticket price from 2014 to 2022.
As most people have suspected, it looks as though ticket prices have increased since theaters started reopening. We estimate ticket-price inflation was about 2% in 2020, 10.5% in 2021, and 0.5% in 2022. That figure for 2022 looks quite low, but it was dragged down by very low ticket prices in Q3. That was mostly due to the lack of new releases in that period and the theaters lowering prices to draw in customers. In particular, thousands of theaters reduced their prices to $3/ticket for National Cinema Day on September 3. That alone will have pulled down the average ticket price for Q3.
The comparison between Q4, 2022 and Q4, 2021 probably gives a more accurate gauge of how ticket prices are changing. The inflation rate between those two quarters was 7%, and the average ticket price hit an all-time high of $11.20 in the last quarter of 2022. Avatar: The Way of Water had a lot to do with that, of course.
We’ve be updating our Market Charts and inflation-adjusted estimates to use these new modeled estimates of ticket prices from Q2, 2020 through Q4, 2022. Going forward, we’ll update our ticket prices once we receive ticket price estimates from the theater chains each quarter. If NATO starts reporting ticket price estimates again, we’ll go back to using their figure though, so we remain in sync with the rest of the industry.
In the meantime, we’d welcome additional data from any theater chain that is open to sharing it with us. We’re happy to receive numbers under an NDA, so long as we can use them to improve our publicly-available estimates.
We’re making our quarterly average ticket price estimates freely available, so please go ahead and use them in your own projects. We just ask that you credit The Numbers as your source.
Sebastian Gomez and Bruce Nash, research@the-numbers.com