October 19th, 2016
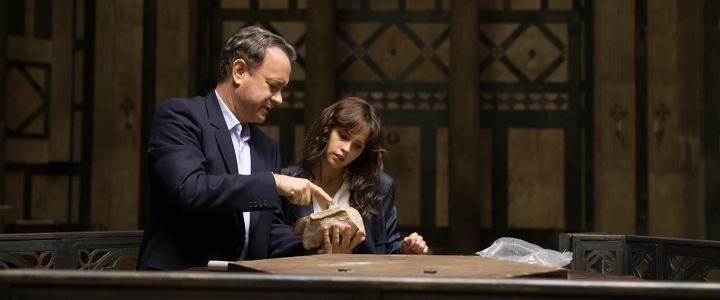
Inferno started its international run in first place with $49.75 million on 12,293 screens in 64 markets. However, its individual markets are a bit of a mess. On the low end, the film only managed second place in the U.K. with $3.62 million on 591 screens, while it also had to settle for second place in Australia with $1.73 million on 266. Given the size of those two markets, this is like opening with just under $20 million here. On the other hand, the film earned first place in Italy ($5.07 million on 679 screens); Russia ($4.81 million on 2,032); and Germany ($4.09 million on 768). Those markets suggest a $40 million to $50 million opening here. Sadly, I think the lower end is more likely here.
More...
August 14th, 2016

A precipitous drop from last weekend won’t be enough to knock Suicide Squad off its perch at the top of the box office chart, according to studio estimates released on Friday. But a 67% fall is steep, even by modern standards. On the bright side, it is less than Batman v Superman’s 69% decline in its second weekend earlier this year, at least according to the estimates. A weak Sunday would put the two films basically neck-and-neck on that front, and it looks increasingly likely that Suicide Squad will end with less than $300 million domestically.
More...
July 12th, 2016

As expected, The Secret Life of Pets earned first place on the weekend box office chart. However, almost no one was expecting it to dominate the way that it did with $104.35 million. There are some calling this film the best opening for a non-franchise animation film, but let’s face the facts... Universal started work on two or three sequels as soon as Friday’s Estimates came in. Meanwhile, Mike and Dave Need Wedding Dates has a good opening in the role of counter-programming with $16.63 million. Overall, the box office pulled in $217 million, which was 14% more than last weekend. More importantly, it is 1.3% more than the same weekend last year. Granted, this is lower than ticket price inflation, but since most people assumed the weekend would suffer a serious decline, this should be seen as a major victory. Year-to-date, 2016’s lead over 2015 grew a tiny bit hitting 2.4% at $6.00 billion to $5.86 billion.
More...
July 7th, 2016
It should be a good weekend at the box office, at least for The Secret Life of Pets. The film is earning great reviews and should become the biggest hit of the month. There is one downside: the competition. There are a lot of options for families among the films currently in theaters, plus another movie from a long-running franchise opening soon. Also opening this week is Mike and Dave Need Wedding Dates, which is an R-rated comedy hoping to survive in the counter-programming role. It could become a midlevel hit, or it could fail to open in the top five. This weekend last year, Minions opened with $115.72 million. The Secret Life of Pets is not going to top that. 2016 has better depth, but likely not by enough to win in the year-over-year comparison.
More...
July 6th, 2016
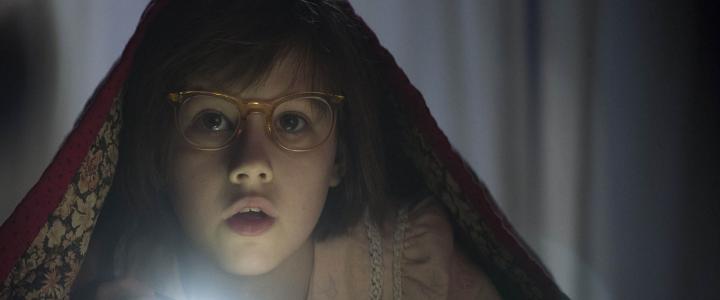
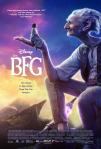
The winners of our Big Fun Prizes contest were determined and the entrants with the closest predictions for The BFG opening weekend were...
More...
July 6th, 2016

The Fourth of July weekend went very well as two of the three new releases beat expectations. However, none of them were able to top Finding Dory, which earned its third win in a row. The Legend of Tarzan was very close in second place, which surprised a lot of analysts, but there might be a logical reason for its success. The Purge: Election Year more than tripled its production budget during its opening three-day weekend, so there’s no chance the studio isn’t giddy over that. The only real disappointment was The BFG, which got lost in the crowd. The overall box office was up from last week, which is a pleasant surprise. Granted, it grew by just under 1.0% to $192 million over the three-day weekend. More importantly, it was 41% higher than the same three-day weekend last year. Add in Monday, and the year-to-date lead rose to $120 million or 2.2% at $5.71 billion to $5.58 billion.
More...
July 3rd, 2016

Three new movies entered the race for box office glory this July 4 weekend. One, The BFG, fell at the first hurdle. One of the other two, The Legend of Tarzan is disappointing, but not disastrous. The third, The Purge: Election Year, won the night on Friday and is headed to a great debut. But, in the end, none were a match for the third weekend of Finding Dory.
More...
July 1st, 2016
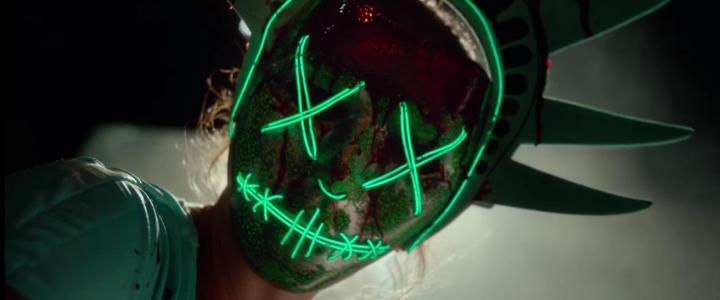
The Purge: Election Year earned the best Thursday previews out of the three wide releases with $3.64 million last night. This is the best in the franchise, just beating the $3.44 million the first film managed and well ahead of the $2.64 million the second film pulled in. On the downside, the film's reviews have slipped to just 57% positive. That's still good, for this genre and it might be a bigger than expected hit.
More...
July 1st, 2016

It's July 1st, which is Canada Day. To celebrate, I wanted to give a gift to my American readers down south, so here's a bunch of "u"s. U, u, u, u, u, u, u, u, u, u, u, u, u, u, u, u, u, u, u, u, u, u, u, u, u, u, u, u, u, u, u, u, u, u, u, u, u, u, u, u, u, u, u, u. Now you can spell words like "colour" and "neighbour" correctly. As for the July preview... June wasn't a good month, despite Finding Dory being on pace to become the biggest hit of the year so far. Most other films failed to match expectations and as a result, 2016's lead over 2015 has nearly evaporated. In fact, ticket sales are below last year's pace. So how does July look in comparison? Well, last July, there were five films that earned more than $100 million, led by Minions, which earned more than $300 million. This July, there are five films that should earn more than $100 million, led by The Secret Life of Pets, which should earned around $250 million. I don't think July 2016 will live up to July 2015, but it should be close. Maybe if one of the expected midlevel hits is a surprise $100 million hit, or if two more of the $100 million hits crack $200 million, then the month will look great. Or one of the expected $100 million hits could flop and 2016 will actually fall behind 2015, even without taking into account ticket price inflation.
More...
June 30th, 2016
It's the first weekend of July, which means I should probably start the monthly preview. (I'm kidding. Although, I did have a computer crash this morning and lost a few hours of work. Save early. Save often.) Like last week, Finding Dory should earn first place over the weekend, while there are a trio of wide releases hoping to take advantage of the holiday. The BFG is the biggest in terms of box office potential. The Legend of Tarzan is the biggest in terms of production budget. Finally, The Purge: Election Year is the biggest in terms of profitability. This weekend last year, Inside Out climbed over Jurassic World for first place, as both films earned just under $30 million, Finding Dory will make almost that much combined.
More...
June 30th, 2016

The winners of our Surge of Independence contest were determined and the entrants with the closest predictions for Independence Day: Resurgence opening weekend were...
More...
June 24th, 2016
July begins next weekend and there are three films hoping to make an impact at the box office. The Purge: Election Year might not hit $50 million domestically, but that's fine given its low production budget. The Legend of Tarzan should do a little better, but it had a troubled production and it cost more than $150 million to make. That leaves The BFG, a.k.a., the Big Friendly Giant. It is a live action family film released by Disney. It's aimed at too young an audience to be a monster hit, but it has a shot at $100 million, which is more than the other two films can say. As a result, it is the only real choice for the target film in this week's Box Office Prediction contest. In order to win, one must simply predict the opening weekend box office number for The BFG.
Whoever comes the closest to predicting the film's opening 3-day weekend box office (Friday to Sunday), without going over, will win a Frankenprize of previously reviewed DVD and / or Blu-rays. I grabbed a few more boxes from storage, so we can do winner's choice again. The choices are, two movies, one TV on DVD release, or three single-disc kids DVDs. I'm out of mystery box items, unless I find some more later on.
Whoever comes the closest to predicting the film's opening 3-day weekend box office (Friday to Sunday), without going under, will also win a Frankenprize, as described above.
Finally, we will be choosing an entrant from the group of people who haven't won, or haven't won recently, and they will win the final Frankenprize.
Note: It is a long weekend, but we only use the three-day, Friday through Sunday box office for this contest.
Entries must be received by 10 a.m., Pacific Time on Friday to be eligible, so don't delay!
More...