April 1st, 2010
Not only did eight new releases reach the top 30 on this March 14's sales chart, but they were very top-heavy on the chart, taking the top three spots and six of the top seven. The new number one DVD was Precious with 726,000 units sold and $12.34 million in consumer spending at retail during its first week of release.
More...
March 9th, 2010
We have a pair of Awards Season players coming out this week. I was supposed to review both Precious and Up in the Air, but they ran out of screeners for the latter. Because of that, it is hard for me to say which one is more deserving of the Pick of the Week honors, so I'm going to award that title to both of them. That said, while the DVD and the Blu-ray for Precious are worth picking up, the Up in the Air Blu-ray is too expensive compared to the DVD.
More...
January 12th, 2010
Avatar returned to the top of the per theater chart thanks to its record-breaking weekend result. It earned more than $50 million in 3,422 theaters for an average of $14,701. Crazy Heart was very close behind with an average of $14,004 in 33 theaters, which suggests further room to expand. Likewise, The Lovely Bones could do reasonably well this Friday when it expands after pulling in an average of $12,857 this weekend; however, there is a note of caution, as the film is still playing in only three theaters.
More...
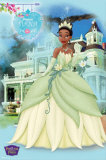
December 1st, 2009
There were more than half-a-dozen films to top $10,000 on the per theater chart, including The Princess and the Frog, which earned close to $800,000 in just two theaters for an average of $393,095. Broken Embraces saw its per theater average rise by more than 10% to $58,993, which bodes well for its chances to expand. Next up was Me and Orson Welles with an average of $15,910 in 4 theaters, while The Road opened with $1.5 million in 111 theaters for an average of $13,534. A trio of top ten moves rounded out the $10,000 club with The Blind Side earning an average of $12,774, Precious took in an average of $10,680, and finally The Twilight Saga - New Moon was right behind with $10,606.
More...
November 24th, 2009
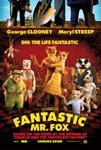
Broken Embraces opened on top of the per theater chart with an impressive average of $53,556 in two theaters, while The Fantastic Mr. Fox was in a close second place with an average $50,878 in four theaters. The overall box office leader, The Twilight Saga - New Moon, placed third with $35,497 in more than 4,000 theaters. Precious saw its best numbers of its run so far, pulling in nearly $11 million in just over 600 theaters for an average of $17,300. The Sun opened with $11,588 in one theater while The Blind Side opened with an average of $10,971 in more than 3,000 theaters.
More...
November 17th, 2009
We have a new champion on the Per Theater Chart with The Fantastic Mr. Fox leading the way with an average of $66,475 in four theaters.
Precious expanded into more than 100 additional theaters but still pulled in an amazing average of $33,762, which was enough for second place.
La Danse climbed to $28,104, while playing again in a single theater (albeit now on two screens).
The overall box office leader, 2012, opened with an average of $19,165 in just over 3,400 theaters.
Uncertainty only earned mixed reviews, but it scored $13,075 in its lone theater.
The End of Poverty? was richly rewarded with $12,593 in its solitary theater.
Two other new releases were neck-and-neck with Four Season Lodge earning $11,667 while The Messenger managed an average of $11,131.
More...
November 10th, 2009
Precious had a record-breaking opening on the per theater chart with close to $1.9 million in just 18 theaters for an average of $104,025.
This is just shy of the record for best per theater average for a live action movie; however, the current record holder, Dreamgirls, opened in fewer theaters and with prestige pricing, so this is arguably the better result.
Precious did set the record for highest per theater average for a film playing in more than 10 theaters.
It wasn't the only film in the $10,000 club with La Danse earning $14,000 in its lone theater while Splinterheads opened with $10,515, also in one theater.
More...
November 3rd, 2009
The per theater chart took a hit over the weekend and no movie topped $10,000; however, An Education was close with an average of $9,737 in 48 theaters.
More...
November 1st, 2009
Michael Jackson's This Is It topped the box office chart in the United States this weekend, but with a relatively disappointing $21.3 million Friday to Sunday, according to Sony's estimates.
While that's good for a concert/documentary film, it's some way behind the $31.1 million opening three-day weekend of the Hannah Montana/Miley Cyrus concert released in 2008.
In fact, This Is It's five day total of $32.5 million only just beats out the Disney concert pic.
More...
October 30th, 2009
The list of limited releases is rather mixed this week with four films, half of which are earning great reviews, while the other half are... not. Two films are earning reviews that suggest it will have a solid shot at significant expansion, while the other half are earning reviews that are so bad that it suggests the films will not even please most genre fans. It will be interesting to see if the good reviews can help these two film thrive, or whether the bad reviews will be enough to sink the other two films.
More...