June 7th, 2011
The summer is usually a really weak time for home market releases, but this week is amazing. Not only are there two $100 million hits coming out on DVD / Blu-ray this week, but there are also half-a-dozen TV on DVD releases, a few limited releases, direct-to-DVD releases, and catalog titles, many of which are worth picking up, or even contenders for Pick of the Week. I tried to narrow the list of contenders down to one, but I couldn't do it. In the end I went with Leverage: Season Three on DVD and True Grit on Blu-ray / DVD Combo Pack as co-winners of the Pick of the Week.
More...
January 23rd, 2007
The
Oscar nominations were handed out today and for the most part they've followed the script written by previous awards committees fairly closely.
More...
December 22nd, 2006
The Devil Wears Prada was the best of a
new bunch winning out in a very, very close race with
Pirates of the Caribbean: Dead Man's Chest at $10.74 million to $10.67 million.
More...
December 16th, 2006
There were a boatload of
new releases to chart this week led by
Pirates of the Caribbean: Dead Man's Chest with $12.93 million, which was just a hair lower than
Superman Returns's open week rentals from a week ago. This week that film placed second with a still impressive $10.71 million.
More...
December 9th, 2006
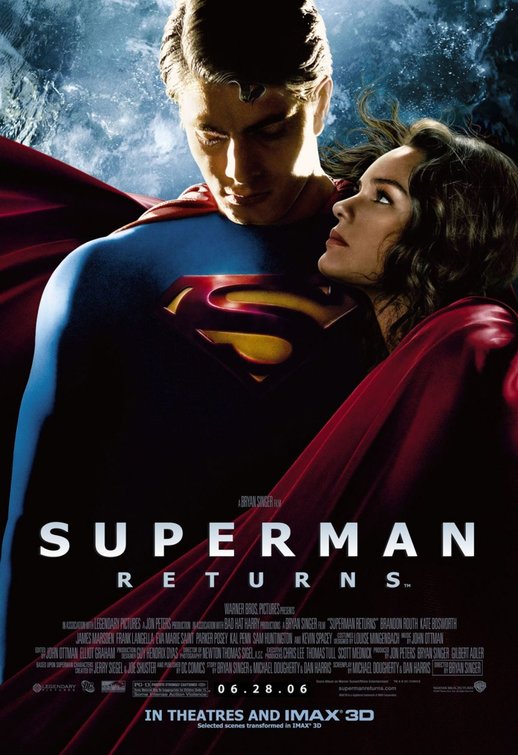
Superman Returns led a group of four
new releases, all of which placed in the top ten. It was the clear winner after taking in $12.95 million during its first week of release, which was one of the best debuts of the year.
More...
December 3rd, 2006
We've been meaning to put out a holiday gift guide for a long, long time; however, the holidays are the busiest time of year for a site like ours so, much like our gift-giving, we've always run out of time to put together the kind of bumper list that we'd like to.
But instead of putting it off yet again, we are going to try to get out a few good gift ideas each week from now until Christmas.
We hope you find the perfect present for that hard-to-buy-for movie fan in your life.
Or find the perfect gift for yourself, of course.
More...
November 27th, 2006
The Thanksgiving long weekend is the busiest time of year for shopping so it makes sense that studios try to rush out as many A-list DVDs for before that weekend and the Tuesday after tends to be a little light.
There are still several hundred DVDs being released tomorrow, 90% of which are Superman related.
Actually, there are fifteen such releases, but the DVD Pick of the Week is not among them.
That honor goes to Clerks II - 2-Disc Collector's Edition, but there were several runners-up including Bones - The Complete First Season, Joan of Arcadia - The Second Season, and of course, Superman - Ultimate Collector's Edition.
More...
October 3rd, 2006
Open Season became the latest film to take advantage of the really big screen experience.
Over its first weekend, the film earned an estimated $1.4 million on just 65 IMAX screens for an average of $21,500.
More...
October 1st, 2006
Ye Yan, a.k.a., The Banquet opened in third place in South Korea with $1.04 million on 183 screens over the weekend and $1.24 million in total. That helped the
Chinese film place sixth overall with $5.52 million on 734 screens in 6 markets lifting its international total to $15.94 million, which is just above its production budget.
More...
September 24th, 2006
Little Man shot up the charts into sixth place with $5.97 million on 1597 screens in 23 markets for a total of $22.63 million internationally. The film had million dollar debuts in both Spain, ($2.06 million on 250 screens), and Mexico, ($1.04 million on 352), while came reasonably close in Russia, ($960,000 on 217 screens, including midweek numbers). In all three markets, the film placed second on the charts. More amazingly is the film's performance in the U.K. as it dipped just 17% to $1.05 million on 315 screens over the weekend and a three-week total of $5.75 million.
More...
September 17th, 2006
The Sentinel climbed into 6th place on the international charts, the best placing the film has earned. It had a few openings, the biggeset being a sixth place, $410,000 debut on 89 screens in South Korea over the weekend, and $469,000 in total. On the other hand, the film place first in Belgium with $197,000 on 36 screens over the weekend and $226,000 in total and third in Denmark with $102,000 on 32 screens over the weekend and $108,000 in total. Overall it earned $3.44 million on 1423 screens in 22 markets for a total of $31.96 million, which puts it about a week from topping its domestic total.
More...
September 10th, 2006
No new openings left
Garfield's A Tail of Two Kitties down 40% to $5.87 million on 3779 screens in 32 markets for a total of $90.08 million. It was reported that the film broke a record for an
animated film in China with $6.7 million putting it ahead of
The Lion King, which is a strange thing to report since the movie isn't
animated. Sure, it has a
CG lead, but that's not the same. As for the film's prospects for the future, hitting $100 million internationally is academic at this point and with several openings to go, including previews in Australia this weekend, the film could finish with close to the $125 million earned by the
original.
More...
September 3rd, 2006
A first place opening in the U.K. helped You, Me & Dupree shoot up the charts nearly reaching the top five. While it did have to settle for sixth place, its $4.32 million on 914 screens in 8 markets was enough to push its still early international total to $13.01 million. Over in the U.K., the film picked up $3.10 million on 409 screens and that was more than double its nearest competitor. The film opened in Iceland over the weekend earning second place to Garfield's A Tail of Two Kitties with $42,000 in three theatres.
More...
August 23rd, 2006
Pirates of the Caribbean: Dead Man's Chest is starting to shed screens and that was part of the reason it fell 43% this weekend, however, it still earned more than the next two films combined while crossing the $500 million milestone. Over the weekend it added $24.82 million on 7014 screens in 51 markets to its international total of $521.46 million while its worldwide total hit $922.72 million. This is the seventh week in a row that the film has topped the international charts tying the previous record set by
Pirates of the Caribbean: Curse of the Black Pearl back in 2003. On the all-time international charts, the film is now in 12th place all-time, just a few million behind
Finding Nemo and is now fifth place
Worldwide. Where does it go from here? It has yet to open in Italy and by the time it does it could reach $1 billion in total ticket sales, but odds are
Return of the King's second place is safe.
More...
August 9th, 2006
For the fifth week in a row,
Pirates of the Caribbean: Dead Man's Chest dominated the international box office earning nearly five times what its nearest competition took in. Over the weekend it brought in $57.32 million on 8208 screens in 50 markets for a total of $392.22 million internationally and $771.92 million worldwide, (at the end of the weekend). A large chunk of this weekend's haul come from new openings, including a phenomenal $17.8 million on 700 screens in France. Other debuts include Hong Kong, ($1.6 million on 35 screens), and South Africa, ($670,000). The film is already the highest grossing movie of the year worldwide, and with strong holds and openings in Spain and Italy still to go, it could top
The Da Vinci Code's international total as well, a total that currently sits at $530.38 million.
More...
August 2nd, 2006
Pirates of the Caribbean: Dead Man's Chest may have lost its box office crown domestically, but it is still rules the international markets. This week it earned $55.34 million while playing on 7,610 screens in 44 markets, lifting its totals to $301.90 million internationally and $660.39 million worldwide.
After the weekend it was sitting in 40th place on the international charts and 26th worldwide. The film opened in first place in Germany with an outstanding $17.34 million on 1,330 screens while Curse of the Black Pearl re-entered the charts in fifth place with just over $500,000.
The film also had million dollar openings in Austria at $2.8 million on 105 screens, Belgium at $2.06 million on 127, and Switzerland at $1.57 million on 101.
Meanwhile, the film was down a jaw-dropping 64% in its second weekend in Japan, earning a still impressive $6.11 million on 764 screens for a total of $32.44 million after just two weeks.
The reason for this steep, nearly vertical drop-off is simple, the Japanese hate cliffhanger endings in movies. They like movies that are individual units and if they feel the film is just a two-hour setup to the next installment, it will suffer at the box office.
More...
July 26th, 2006
Pirates of the Caribbean: Dead Man's Chest added another 10 markets to its international run as it again top the charts with $60.10 million on 6079 screens for a total of $214.10 million internationally. The film became the fifth film of the year to earn $200 million internationally and the third to cross $500 million worldwide. Among the host of number one openings this week were Japan at $16.65 million on 761 screens and Mexico with $5.67 million on 791 screens. Other impressive debuts include Brazil, ($3.1 million), Argentina ($1.3 million), Poland ($1.17 million), and Chile ($1.1 million). Its biggest market overall continues to be the U.K. where it added $7.19 million on 520 screens to its running tally of $58.48 million while it has topped $20 million on both Australia, ($21.68), and Russia, ($20.51). The film opens in Germany, France, and Spain in consecutive weekends before closing its international run with its Italian debut in September.
More...
July 19th, 2006
Pirates of the Caribbean: Dead Man's Chest opened in another 17 markets over the weekend taking first place in all of them while adding $58 million on 3,336 screens. This gave it a two-week international total of $125 million and helped it become the seventh film this year to top $100 million internationally. The film's best opening of the week was in Russia where it captured 85% of the market while scoring a record-breaking $9.24 million on 552 screens over the weekend and $10.87 million in total. It also broke records in a trio of smaller markets: Singapore with $1.8 million on 65 screens, Malaysia with $1.1 million on 70 and in the Ukraine with $1 million on 125. Other multi-million dollar openings were Sweden, ($3.49 million on 127), Denmark, ($2.58 million on 85), and Netherlands, ($2.22 million on 132). Holdovers remained strong led by the U.K. at $11.14 million on 514 screens for a total of $49.23 million, but that was down 47% from its opening. On the other hand, the film was down just 32% in South Korea to $3.84 million on 396 screens over the weekend and $13.55 million in total and 37% in Australia to $5.31 million on 490 screens for a two-week total of $17.32 million.
More...
July 17th, 2006
The news was mostly good over the weekend with practically every film in the top five beating expectations, and the only one that didn't, Pirates of the Caribbean, missing by a rounding error.
However, the overall box office was still down a huge 27% from last weekend to $159 million.
More significantly, it was down 4% from the same weekend last year breaking 2006's eight-week winning streak.
Even so, strong midweek numbers allowed 2006 to stretch its lead over 2005 to a very healthy 6%.
More...
July 13th, 2006
There are a lot of questions about this weekend's box office; which film will finish in first place is not one of them. Pirates of the Caribbean: Dead Man's Chest will repeat as overall box office champion, but there is a question of how far it will fall during its second weekend of release. Also, the two new wide releases are tracking with nearly identical numbers and that should set up a real race for second place.
More...
July 12th, 2006
Pirates of the Caribbean: Dead Man's Chest started its international run with day-and-date releases in seven markets and on 1552 screens earning an astounding $46.64 million. Over half of that total came from the U.K. where it debuted in first place with $21.21 million on 514 screens over the weekend and $25.41 million in total. That was the film's only 8-figure opening, but it also did well in Australia with $8.33 million on 489 screens and New Zealand with $1.17 million on 95 screens. The film set a record for top opening for a Hollywood film in South Korea with $8.4 million on 450 screens while topping the market in Taiwan with $1.9 million on 18, Thailand with $1.4 million on 110, and an estimated $100,000 in Uruguay. In most markets the film earned double what its
predecessor made. However, if one were to look for a downside, you'd quickly notice that the film didn't break nearly as many records internationally as it did domestically. It was a top ten all-time opening in many markets, but not the colossal it was here.
More...
July 10th, 2006
We finally had a blockbuster live up to, and exceed its expectations. And with the record-destroying run of Pirates of the Caribbean: Dead Man's Chest the total box office exploded to nearly $220 million, which was up 42% from last year and more than 46% from the same weekend last year. This total is the largest ever for a weekend breaking the previous record of $188 million, which was earned in June of 2004 when Harry Potter and the Prisoner of Azkaban opened. And overall, 2006's lead over 2005 grew from 3% to 5%, easily more than ticket price inflation.
More...
July 6th, 2006
While Superman Return disappointed during its theatrical opening this past weekend, it did break records on IMAX screens. The film opened on 76 IMAX screens and pulled in $6.83 million during its first week of release for a record-breaking per screen average of $89,804. While internationally it opened on 11 screens and also set a record for week long per screen average at $67,888. This is the first live action film to undergo IMAX's 2D to 3D conversion and the 20 minutes of 3D action certainly helped draw people into theatres. Whether this was a result of novelty of genuine appeal will go a long way in determining how many more records the film can break.
More...
July 6th, 2006
The latest "Sure Thing" openings tomorrow.
But this Summer seven previous "Sure Things" have already come out and only one or two have actually lived up to expectations.
Both The Da Vinci Code and X-Men: The Last Stand managed to do so, more or less, but with The Da Vinci Code my expectations were somewhat lower than the industry average and its final box office is still looked at as a disappointment by many.
Will Pirates of the Caribbean: Dead Man's Chest break this trend, or will it be the latest victim in a summer of over-hyped misses?
More...
July 6th, 2006
Strangers With Candy easily led the per theatre charts this weekend with just over $43,000 in 2 theatres for an average of $21,571. Since it debuted on Wednesday, the film has made almost $70,000. Second place went to the overall box office champ, Superman Returns, which pulled in a solid average $12,924 of over the three-day weekend. Last week's winner was the only holdover to reach $10,000 average as Wassup Rockers brought in nearly $35,000 on 3 screens for an average of $11,570.
More...
July 5th, 2006
Superman Returns started its staggered international release schedule with a first place, $22.13 million opening on 1779 screens in 11 markets. Highlights include a $3.88 million Australian debut on 409 screens and a $3.79 million debut on 355 screens in South Korea, ($5.00 million including Thursday). In both markets the film finished first. The rest of the markets were decidedly smaller, but the film still cracked $1 million in the Philippines with $2.58 million on 81, (while bringign in 90% of the market), Taiwan with $1.58 million on 151 screens, India with $1.49 million 274, Thailand with $1.47 million on 204, and Singapore with $1.16 million on 73. The film has no major openings this weekend and will slip to second with the debut of
Pirates of the Caribbean: Dead Man's Chest, but the two should battle for supremacy over the coming weeks.
More...
July 5th, 2006
While we had one film missing expectations, and another beating them by nearly the same amount, for the most part, the weekend played out exactly as expected. Compared to last weekend, the $154 million made at the box office from Friday to Sunday was up 9.4%.
More importantly, it was up 7.9% from the same weekend last year.
(Comparing the 5-day weekend to last year is pointless since the holiday fell on a Monday last year.)
Year-to-date, 2006 is 3% higher than 2005 while the summer pace is ahead by a smaller 1% margin.
More...
June 30th, 2006
It seems a lot of people are starting their holidays early, but not this column as it's the busiest it's been in more than a month. Including in this list are a few newly released teaser trailers and a handful of flash sites, most of which are worth checking out. But the best of the best is the
Running With Scissors -
Official Site.
More...
June 29th, 2006
Superman Returns posted a very respectable, but not spectacular, gross of $21,037,277 on its opening day yesterday.
That's the 8th biggest opening Wednesday in history (see chart below), and slightly less than the opening day's receipts for The War of the Worlds, which opened in the same Wednesday-before-July-4 slot last year.
It's still too early to tell how the weekend will work out, but a comparison with War of the Worlds suggests an opening weekend (Friday-Sunday) of around $65 million.
More...
June 28th, 2006
With this being the July 4th long weekend, several films are getting a jump on weekend rush, including what could become the biggest hit of the year. But there seems to be some signs of weakness in the man of steel. Will some cinematic kryptonite spoil Superman's return to theaters?
More...
June 26th, 2006
With what could be the biggest hit of the year opening in just a few days, we have our biggest box office prediction contest yet, with three winners taking home a total of 3 copies of Sound of Superman CDs, 3 teaser posters, 2 final posters, and a hat.
Two of the winners will be decided based on who can predict the opening weekend box office for Superman Returns, while the third will be chosen at random from the list of eligible entries.
All three will win a copy of the CD and the teaser poster, while the person who comes closest to predicting the opening 3-day weekend (Friday to Sunday), without going over, and the person who closest to predicting the opening 3-day weekend (Friday to Sunday), without going under, will each win a copy of the final poster.
Finally, the person who comes closest overall will also take home the Superman Returns hat.
Entries must be received by 10 a.m., Pacific Time on Thursday to be eligible, so don't delay!
More...
June 23rd, 2006
Just an average week with
You, Me and Dupree -
Official Site taking the prize for the best of the week.
More...
June 19th, 2006
It may seem like a really slow week for DVD releases, but this is because several releases were grouped together. I have one section for the five
Alfred Hitchcock releases instead of spreading them out and padding the word count. Taking that into account, the week is about average in terms of quantity, and quality. There were a handful of contenders this week, and a few that looked good in advance but the special feature were a let down. In the end I went with
NewsRadio -
The Complete Fourth Season as the best of the best while
Married With Children -
The Complete Fifth Season earns and honorable mention. ... "Go with him." (If you get that reference, you probably already have the latter release pre-ordered.)
More...
June 19th, 2006
As a preview for next week's Superman Returns contest, this week amateur Box Office prognosticators have a shot at winning the
Superman Returns Soundtrack by predicting the opening weekend box office of
Click. Whoever comes closest to predicting the opening 3-day weekend (Friday to Sunday),
without going over, will win the
Superman Returns Soundtrack. Entries must be received by 10 a.m., Pacific Time on Friday to be eligible, so don't delay!
More...
June 9th, 2006
It was a slow week it terms of major updates and that allowed the
Fanboy in me to grant
The Transformers -
Official Site the gloriously premature Weekly Website Award. Let's hope the full site lives up to this title.
More...
June 2nd, 2006
There were a few major updates for a few major movie sites this week, and it was one such site that walked away with the Weekly Website Award -
Pirates of the Caribbean: Dead Man's Chest -
Official Site.
More...
June 1st, 2006
May might have gotten off to a slow start, but it sure made up for it in the end. June looks to keep up the fast pace, but out of the dozen or so movies opening wide this month, only two look like they have to potential to be monster hits and after that there is a huge drop-off in box office potential. There are a few others that should earn their keep, and maybe one or two that will surprise, but most look average at best.
More...
May 16th, 2006
There was very little to celebrate for
Poseidon over the weekend. Sure, the Sunday numbers turned out to be much stronger than estimated, but the real good news was the film's performance at IMAX theatres nationwide. Playing on just 62 screens, the film was able to bring in an estimated $1.4 million. Its per theatre average on IMAX was $22,700 compared to an average of $5940 in conventional theatres.
More...
May 5th, 2006
It was not a great week when it comes to new websites with most of the really interesting updates coming in the form of new trailers. However, it was one of those sites,
Casino Royale -
Official Site, that was awarded the Weekly Website Award. I just hope when the site goes live in two weeks by Fanboy enthusiasm is rewarded.
More...
January 11th, 2006
While the overall domestic box office dropped by an estimated 6% this year, IMAX had a record breaking year for total ticket sales (although exact figures were not released).
Much of this success was due to DMR releasing of blockbuster Hollywood films like Batman Begins, Charlie and the Chocolate Factory, and Harry Potter and the Goblet of Fire.
More...
December 8th, 2005
During the past week promotional websites for several movies were launched and some older ones added additional content. Despite being there being two weeks between updates, this was not a very strong week. Sure, there were plenty of websites updated, but not a lot that really stood out as being award worthy. In the end it was
Clerks 2: The Passion of the Clerks -
Official Site that was the best of the bunch and hopefully it will continue to grow and earn that award.
More...
November 24th, 2005
During the past week promotional websites for several movies were launched and some older ones added additional content. Here the list of this week's releases, a couple of new sites and few updates, including this week's winner,
The Producers -
Official Site.
More...
November 10th, 2005
During the past week promotional websites for several movies were launched and some older ones added additional content. Here the list of this week's releases, a couple of new sites and few updates, including this week's winner,
Aeon Flux -
Official Site
More...
October 6th, 2005
During the past week promotional websites for several movies were launched and some older ones added additional content. Here the list of this week's releases, a couple of new sites and few updates, including this week's winner,
Waiting... -
Official Site.
More...
January 6th, 2003