February 17th, 2014
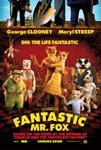
It's a horrible week for me. The biggest release of the week is Game of Thrones: Season Three. I was supposed to review the Blu-ray, but it hasn't arrived yet. Usually HBO releases arrive a little early, not late. On the other hand, it was a holiday last week, at least it was where I live, so perhaps the mail was delayed. Or perhaps they ran out of copies before they got to me. It's the uncertainty that sucks the most, because right now the Blu-ray Combo Pack costs just $30 on Amazon.com. Of course you buy it at that price. The only reason not to, is because you want the Limited Edition Box Set instead. On the other hand, after Game of Thrones, there are practically no major releases. According to Amazon.com, the second best new release is the Criterion Collection release for The Fantastic Mr. Fox. It's a great movie, but it failed to make an impact at the box office, so a Blu-ray double-dip shouldn't sell that well.
More...
April 7th, 2010
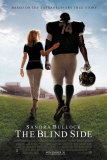
There were several new releases on the sales chart this week; as many as nine, depending on how you look at things. The best selling DVD was definitely a new release: The Blind Side sold 2.54 million units generating $41.63 million in sales.
More...
April 6th, 2010
There is not a single first-run wide release on this week's list. The biggest new release of the week is Bad Lieutenant: Port of Call New Orleans, which made less than $2 million in theaters. The biggest selling release of the week is the Lord of the Rings - The Theatrical Trilogy on Blu-ray, but the extended edition has already been announced. After those two releases there is practically nothing of interest. In all honesty, many of the releases on this list would have been ignored had this been a busy week. The release I'm looking forward to the most is Yesterday Was A Lie, but the DVD is late, so I don't know if it is merely worth buying or if it is worthy of the Pick of the Week honor.
More...
March 21st, 2010
The Fantastic Mr. Fox is a stop motion animated film based on a book by Roald Dahl. This is not the first such film made, as James and the Giant Peach was made more than a decade ago. This film was adapted by Noah Baumbach and Wes Anderson, with Wes Anderson also directing. Wes Anderson's films tend to have a unique tone, while Roald Dahl's books also have a uniqueness to them. Can the filmmakers find a way to combine these two styles while still appealing to both target demographics? Is that even possible?
More...
March 3rd, 2010
With our annual Oscar Prediction contest underway, now is the best time to look at the nominees and try and figure out which films are the favorites and which should just feel honored to be nominated. Today we look at Best Animated Feature Film, which is the least competitive category that we will be dealing with this year.
More...
February 2nd, 2010
Oscar nominations were announced at 5:38 this morning, continuing a tradition that have never been adequately explained to me. (Why so early in the morning? Does earning an Oscar nomination become sweeter if people have to wake you up to congratulate you?) Leading the way in nominations were Avatar and The Hurt Locker, both of which pick up nine nods each, many of them in the same categories.
More...
January 6th, 2010
The Producers Guild of America announced their nominations this week, and while there are only three categories for theatrical releases, they tend to be quite accurate predictors for the Oscar nominations.
This is great news for Up, which picked up nominations in two of the three categories.
More...
December 16th, 2009
The Hollywood Foreign Press Association announced their nominations this week, but looking over the list of films chosen, it is hard to declare any one film as the big winner. Up in the Air did pick up six Golden Globe nominations, including several of the most prestigious nominations, but it is far from the only major player.
More...
December 7th, 2009
It was one of those good news / bad news weekends; however, the bad news was minor compared to the overwhelming positive stories to talk about. Yes, the overall box office plummeted 47% from last weekend to $99 million, but that was expected for a post-holiday weekend and it was still 20% higher than the same weekend last year. Also, total ticket sales for the year now sit at $9.66 billion, which is not only 8.5% higher than last year's pace, it is within a rounding error of 2007's record-setting total.
That means it is possible that 2009 has already set the record for biggest yearly box office with three weeks left in the year.
More...
November 30th, 2009
Thanksgiving was a record-breaking weekend in more than one way.
First, total ticket sales amounted to $188 million over three days and $273 million over five, which is a record for the long weekend.
Over the three-day portion of the weekend, the box office was actually down 28% from last weekend, but compared to last year it was up just under 16%, while the five-day total was nearly 17% higher.
Year-to-date, 2009 has earned a total of $9.52 billion, which is 8.4% higher than the same point last year.
In fact, 2009 is now the third-highest-grossing year of all-time and just $150 million away from earning the crown.
Breaking the record for total box office is just a matter of when, not if, while 2009 could be the first year total ticket sales crack $10 billion.
More...
November 29th, 2009
The Twilight Saga: New Moon held on to top spot at the box office over the weekend, but only by a couple of million dollars, according to studio estimates released on Sunday.
The Blind Side had a fantastic second weekend, with an 18% increase from its opening, and came close to pulling off a surprise victory.
More...
November 26th, 2009
It's Thanksgiving long weekend, one of the best holidays in terms of box office drawing power. However, none of the new releases seem like they have what it takes to really draw in moviegoers. On the other hand, New Moon broke a number of records last weekend, and it has a slim chance at breaking a few more this weekend. Even if it doesn't, it should top the top film from last year, Four Christmases, which should lead to another gain year-over-year.
More...
November 24th, 2009
Broken Embraces opened on top of the per theater chart with an impressive average of $53,556 in two theaters, while The Fantastic Mr. Fox was in a close second place with an average $50,878 in four theaters. The overall box office leader, The Twilight Saga - New Moon, placed third with $35,497 in more than 4,000 theaters. Precious saw its best numbers of its run so far, pulling in nearly $11 million in just over 600 theaters for an average of $17,300. The Sun opened with $11,588 in one theater while The Blind Side opened with an average of $10,971 in more than 3,000 theaters.
More...
November 22nd, 2009
After enjoying impressive box office and home market sales over the last year for Twilight, the industry knew that Summit had a potential blockbuster franchise on its hands.
This weekend has proved that they have a franchise as big as anything else in the industry.
The Twilight Saga: New Moon opened on Friday with an extraordinary estimated $72.7 million, the biggest single day in box office history (see list).
And, while it couldn't quite maintain that pace through the entire weekend, the studio reported a final weekend estimate of $140.7 million this morning, the third-biggest weekend of all time (see list).
More...
November 17th, 2009
We have a new champion on the Per Theater Chart with The Fantastic Mr. Fox leading the way with an average of $66,475 in four theaters.
Precious expanded into more than 100 additional theaters but still pulled in an amazing average of $33,762, which was enough for second place.
La Danse climbed to $28,104, while playing again in a single theater (albeit now on two screens).
The overall box office leader, 2012, opened with an average of $19,165 in just over 3,400 theaters.
Uncertainty only earned mixed reviews, but it scored $13,075 in its lone theater.
The End of Poverty? was richly rewarded with $12,593 in its solitary theater.
Two other new releases were neck-and-neck with Four Season Lodge earning $11,667 while The Messenger managed an average of $11,131.
More...
November 13th, 2009
We should be seeing a lot of Oscar contenders coming out in the coming weeks, but while there are a couple of films on this week's list that are earning outstanding reviews, most are not.
Some are earning reviews that are good, but perhaps not good enough to survive limited release, while others are not even reaching the 50% positive level.
More...
November 7th, 2009
Cloudy With A Chance Of Meatballs fell out of the top five but still earned $5.18 million on 2568 screens in 39 markets for a total of $52.45 million so far. This was only 31% lower than last weekend, with no major market openings. In fact, the film doesn't have another major market opening till it debuts in Australia at the end of the month, while it still has openings in Italy and Spain by the end of the year, and it doesn't end its run till early next year with openings in Germany and some midlevel markets.
More...
November 1st, 2009
October was not a month to remember, as only two films really beat expectations. (Although Paranormal Activity was the most unexpected hit during the October, it actually opened in September, so one could argue it's not really an 'October hit'.) This month we have a massive collection of potential blockbusters, some potential Oscar contenders, as well as a few unfortunate films that might be squeezed out by the competition. Compared to last November, we might have the same number of $100 million hits, assuming all movies match expectations (fat chance); we have a limited release from this month become the Awards Season darling and reach that milestone (monstrously unlikely); and we count The Princess and the Frog as a November releases (intellectually dishonest). That said, if three or four legitimate November releases reach that milestone, then 2009 will be on pace to tie or break the record for most $100 million released in one calendar year. But overall, 2009 will likely see its lead over 2008 shrink during the next 30 days.
More...
October 31st, 2009
The Ugly Truth reached a major milestone over the weekend with $5.75 million on 2046 screens in 55 markets for a total of $102.27 million internationally. Its biggest market of the weekend was Spain, where it added $1.86 million on 360 screens for a total of $5.17 million. With a debut in Italy a few weeks away, it will likely fall sharply next weekend, but should have no trouble earning $200 million worldwide before its run is over.
More...
August 7th, 2008
This week's round of new casting information contains updates for Edge of Darkness, Inglorious Bastards, Rachel Getting Married, and more!
More...
March 20th, 2008
This week's round of new casting information contains updates for The Grand, The Proposal, The Legend of Secret Pass, and more!
More...
October 11th, 2007
This week's round of new casting information contains updates for Avatar, Harry Potter and the Half-Blood Prince, Star Trek XI, and more!
More...
May 20th, 2007
This week's round of new movie release information contains release dates for The Game Plan, Prom Night, Ice Age 3 and more.
More...