George Clooney

Best known as a Leading Actor based on credits in that role in 29 films, with $3,539,879,181 worldwide aggregate box office (rank #57)
Best-known acting roles: Matt Kowalski (Gravity), David Cotton (Ticket to Paradise), Frank (Tomorrowland), Danny Ocean (Ocean's Eleven), Captain Billy Tyne (The Perfect Storm)
Best-known technical roles: Argo (Producer), Ticket to Paradise (Producer), The Boys in the Boat (Director), The Boys in the Boat (Producer), The Monuments Men (Director)
Most productive collaborators: Sandra Bullock, Alfonso Cuarón, Julia Roberts, Ol Parker, Grant Heslov
Born: May 6, 1961 (62 years old)
                                    

  1. Summary
  2. News
  3. Acting Credits
  4. Technical Credits

Career Summary


  MoviesDomestic
Box Office
International
Box Office
Worldwide
Box Office
As an ActorLeading29$1,687,538,021$1,852,341,160$3,539,879,181
Lead Ensemble Member6$447,543,782$715,989,535$1,163,533,317
Supporting6$324,377,882$187,410,768$511,788,650
Inverviewee2$245,201$0$245,201
Narrator1$0$0$0
(Unclassified)1$0$0$0
In Technical RolesProducer14$503,071,648$420,869,790$923,941,438
Director9$256,293,512$182,129,336$438,422,848
Executive Producer7$265,928,163$190,800,525$456,728,688
Screenwriter4$156,270,550$152,276,643$308,547,193

Career Trend

This graph shows George Clooney’s score on our annual analysis of leading stars at the box office. The Star Score represents points assigned to each of the leading stars of the top 100 movies (based on box office) in the current year and two preceding years. For appearing in the number one movie in a year a star gets 100 points, the number two movie 99 points and so on..

Latest Ranking on Selected Box Office Record Lists


RecordRankAmount
Top 100 Stars in Leading Roles at the Domestic Box Office 79 $2,135,081,803
Top Stars at the Domestic Box Office (Rank 201-300) 229 $2,459,704,886
Top 100 Stars in Leading Roles at the International Box Office 90 $2,568,330,695
Top Stars at the International Box Office (Rank 301-400) 366 $2,755,741,463
Top 100 Stars in Leading Roles at the Worldwide Box Office 82 $4,703,412,498
Top Stars at the Worldwide Box Office (Rank 301-400) 309 $5,215,446,349
Top Grossing Director at the Domestic Box Office (Rank 301-400) 348 $256,293,512
Top Grossing Executive Producer at the Domestic Box Office (Rank 501-600) 569 $265,928,163
Top Grossing Producer at the Domestic Box Office (Rank 201-300) 284 $503,071,648
Top Grossing Screenwriter at the Domestic Box Office (Rank 801-900) 808 $156,270,550
Top Grossing Director at the International Box Office (Rank 501-600) 545 $182,083,831
Top Grossing Executive Producer at the International Box Office (Rank 901-1,000) 988 $190,800,525
Top Grossing Producer at the International Box Office (Rank 401-500) 446 $420,824,285
Top Grossing Screenwriter at the International Box Office (Rank 901-1,000) 944 $152,276,643
Top Grossing Director at the Worldwide Box Office (Rank 401-500) 430 $438,377,343
Top Grossing Executive Producer at the Worldwide Box Office (Rank 701-800) 729 $456,728,688
Top Grossing Producer at the Worldwide Box Office (Rank 301-400) 355 $923,895,933
Top Grossing Screenwriter at the Worldwide Box Office (Rank 801-900) 873 $308,547,193

See the Acting Credits tab for all Acting Box Office Records and the Technical Credits tab for all Technical Box Office Records.


Holiday theater counts: Wonka staves off a rush of newcomers heading into the Christmas weekend

December 21st, 2023

Wonka

As the lone wide release to enter theaters last week, Wonka dominated both the domestic and international box office, scoring a solid $39 million from North American showings, while adding just over $54 million to its previous overseas total of $59 million. The Willy Wonka origin story starring Timothée Chalamet will begin its sophomore frame by adding 10 locations this week, making the musical the widest film in the land with availability in 4,213 cinemas. Wonka will face far stiffer competition however this week at the box office as a bevy of new films make their way into theaters in time for the Christmas holiday. More...

Theater counts: Ticket to Paradise is propelled to widest release as it expands to 4,066 theaters

November 3rd, 2022

Ticket to Paradise

After spending its first two weeks in the shadow of Black Adam at both the box office and as the widest release, Ticket to Paradise is adding 374 locations to kick off its third week, clocking in with 4,066 theaters to be exact, while also becoming the only film showing in over 4,000 cinemas this weekend, with Black Adam narrowly falling under that mark with 3,985. The romantic comedy starring Julia Roberts and George Clooney has so far amassed $128 million in worldwide earnings, including $38 million from North American patrons. More...

Weekend projections: Black Adam and Ticket to Paradise both out-perform expectations

October 23rd, 2022

Black Adam

Black Adam should hit $67 million over its opening weekend, and Ticket to Paradise will post around $16.3 million, according to studio estimates released on Sunday morning. Both films are over-performing compared to our model’s prediction going into the weekend. Even though neither is breaking records, their relative strength is some much-needed good news for the industry, particularly considering the weakness of some other top 10 films. More...

Weekend predictions: Black Adam hoping to top $60 million on debut

October 21st, 2022

Black Adam

We are slowly pulling out of the doldrums at the box office, but (to mix metaphors) there’s still a long climb ahead. Black Adam is poised to post the biggest opening weekend since Thor: Love and Thunder debuted with $144 million over the weekend of July 8, but it won’t come anywhere near that figure. In fact, based on what we’re seeing so far, it won’t manage half of Thor’s opening number, with $60 million looking like the benchmark for the movie based on the current market conditions and its $7.6 million in previews on Thursday. Ticket to Paradise will likewise have the biggest opening for a romantic comedy in a long while, without entirely setting the world on fire. More...

Theater counts: Black Adam bolts into a stellar 4,402 theaters

October 20th, 2022

Black Adam

As has been the case with many films during the pandemic era, this week’s widest release was originally scheduled to hit theaters last year. Debuting in 4,402 locations, Black Adam positions itself comfortably between Minions: The Rise of Gru (4,391 theaters), and The Dark Knight Rises (4,406 theaters) as the 21st-widest release in history and the fifth widest film to debut this year. Meanwhile, finally making its arrival to North American cinemas, is the George Clooney and Julia Roberts romantic comedy, Ticket to Paradise. The Ol Parker-directed film will show in a respectable 3,543 locations. More...

Ticket to Paradise trailer

October 18th, 2022

Romantic comedy starring George Clooney and Julia Roberts opens exclusively in theaters on Friday, October 21 ... Full Movie Details.

Exes David and Georgia find themselves on a shared mission to stop their lovestruck daughter from making the same mistake they once made after they learn that she is planning to marry a man she just met. More...

Weekend Predictions: Can Jigsaw Still Fit at the Box Office?

October 26th, 2017

Jigsaw

There are three wide releases coming out this week, although only Jigsaw is expected to make any real impact at the box office. The other two, Suburbicon and Thank You for Your Service, are opening in barely more than 2,000 theaters and neither of them are expected to do well at the box office. Meanwhile, Tyler Perry’s Boo 2: A Madea Halloween, has an actual shot at repeating in first place, mostly because of the weak competition. This is terrible news for the overall box office, as it means we are going to have a hard time matching last year’s box office, even though last year there was only one wide release, Inferno. More...

2017 Preview: October

October 1st, 2017

Blade Runner 2049

September destroyed the previous September monthly record for total box office take, with $800 million or so (we won’t know the exact figure until after the weekend), which tops 2016’s record of $616 million. Granted, this is almost entirely due to It’s record breaking run, and the rest of the month was merely average. Kingsman: The Golden Circle was the only other film to come close to $100 million. October doesn’t look any better, as far as depth is concerned. Blade Runner 2049 is widely expected to be the biggest hit of the month, but it is the only film expected to reach $100 million domestically. Boo 2 should be the second biggest hit of the month, while there are only a couple of other films that have a shot at $50 million. Part of the problem is the level of competition, as there are 16 films opening during the four October weekends. (Needless to say, some of the predictions below will be a little short, as there’s not much to say about a film that will barely open in the top ten and disappear two weeks later.) That’s way too many and most will be buried by the competition. Last October was a flop, as no film earned more than $100 million at the box office. There were a few films that came close, including the original Boo! movie. As long as Blade Runner 2049 matches expectations, 2017 should win the year-over-year comparison by a small margin. If we get one surprise hit, then 2017 has a real shot at closing the gap with 2016 by a significant margin. I choose to be cautiously optimistic. More...

Suburbicon Trailer

July 27th, 2017

Black comedy starring Matt Damon and Julianne Moore, directed by George Clooney, written by Joel and Ethan Coen, opens October 27 ... Full Movie Details. More...

Weekend Predictions: Civil War will Win Weekend, but will New Releases Earn any Money?

May 12th, 2016

Money Monster

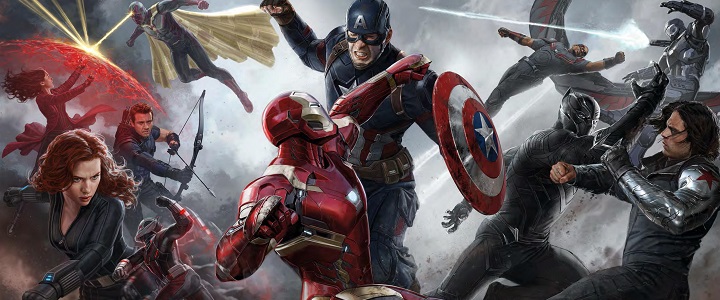
There's not much mystery over what movie will come out on top of the box office this weekend. Captain America: Civil War will repeat as champion, as neither Money Monster nor The Darkness are expected to be box office hits. In fact, both of them combined will earn less in total than Civil War will make over the weekend. Unfortunately, this weekend last year had a one-two punch with Pitch Perfect 2 and Mad Max: Fury Road. Civil War will beat those two individually, but 2015's depth is going to be really hard to top. Fortunately, 2016 has such a lead so far that it can weather this storm. More...

2016 Preview: May

May 1st, 2016

Captain America: Civil War

April started on a soft note and ended weak, but thanks to The Jungle Book, overall the month was actually really good. That's what happens when you get a surprise $300 million hit. This bodes well for May, which is both a slow month and a fantastic month. There are only four weekends and only eight movies coming out, but of those eight films, five have a shot at $100 million. The potential blockbusters are led by Captain America: Civil War, which is not only going to be the biggest hit of the month, but according to a Fandango survey, it is the most anticipated film of the summer. (On a side note, Finding Dory is the most anticipated family film of the summer and Ghostbusters is the most anticipated comedy of the summer. I was surprised by the last result.) Both Alice Through the Looking Glass and X-Men: Apocalypse have real shots at $200 million. One of them could get to $300 million, if they weren't opening against each other. Overall, the month looks excellent. Even better, last May there was only one monster hit, The Avengers: Age of Ultron, and most analysts think Captain America: Civil War will beat it at the box office. (There's also the issue of the misalignment in the weekends, which hurt April, but will really help May.) More...

2016 Preview: February

February 1st, 2016

Deadpool

As expected, January was dominated by holdovers with Star Wars: The Force Awakens and The Revenant leading the way. That's not to say there were no new releases that did well, as Ride Along 2 and Kung Fu Panda 3 were hits with moviegoers. Looking forward, there is only one film that looks like a sure hit, Deadpool. There's a slim chance it could be a surprise $200 million hit. There's a much better chance it will be the only $100 million hit. Conversely, last February started with a $100 million hit coming out, The SpongeBob Movie: Sponge Out of Water, while there were two other $100 million movies to come out that month, Fifty Shades of Grey and Kingsman: The Secret Service. Looks like 2016 is going to lose in the year-over-year comparison. More...

2015 Preview: May

May 1st, 2015

Mad Max: Fury Road

April is over and there was good news and bad news. Good news: Furious 7 crushed the competition, and broke records along the way. Bad news: Furious 7 crushed the competition and no other April release will earn as much in total as Furious 7 earned during its opening day. Fortunately, Furious 7 was so strong that it carried April of 2015 to a draw when compared to April of 2014. May has a lot of similarities to April. The Avengers: Age of Ultron is expected to break records during its opening weekend and even the low end has it earning more than $1 billion worldwide. Unfortunately, no other film is going to come close to that figure. There are five other films with a potential to reach $100 million at the box office. The keyword there is "potential". There's a chance less than half of those five films will get to that milestone. And like last April, last May had much better depth with five films that reached $100 million, including four that surpassed $200 million. Age of Ultron will earn more than the combined totals of Maleficent, last month's winner, and X-Men: Days of Future Past, which placed second for the month. I am a little concerned about the lack of depth this month and this could cause May to lose in the month-over-month comparison in the end. More...

Tomorrowland Trailer

February 26th, 2015

Sci-fi adventure starring Britt Robertson and George Clooney, directed by Brad Bird opens May 22... Full movie details... More...

DVD and Blu-ray Releases for May 20th, 2014

May 19th, 2014

It's that time of year, the weakest time of year on the home market. This week there are four first-run releases, but only one of them earned overall positive reviews and only one of them did well at the box office. Fortunately, it was the same film, About Last Night. If you are a fan of romantic comedies, then the DVD or Blu-ray is worth picking up, but it is not Pick of the Week material. For Pick of the Week, I went with Nosferatu the Vampyre on Blu-ray. More...

2014 Preview: February

January 31st, 2014

Lego poster

After a weak start, January rebounded and a couple of films on last month's preview cracked $100 million at the box office. Granted, Lone Survivor is technically a December release, but Ride Along will become one of the rare January releases to reach the century mark. Unfortunately, there doesn't appear to be too many February releases that have a real shot at $100 million. It is very likely that The Lego Movie will reach that milestone, but most of the rest of the movies will be lucky if they reach $50 million. Last February was very similar. We had one surprise $100 million hit, Identity Thief, plus a couple of solid midlevel hits, Warm Bodies, for instance. However, for the most part, the month was one miss after another. This means 2014 could continue its winning ways, or at the very least, shouldn't fall behind 2013's pace. More...

Weekend Estimates: Gravity Breaks October Record, Stakes Oscar Claim

October 6th, 2013

Success at the box office is no guarantee of awards, but it certainly doesn't do any harm. And by that metric, Gravity's chances of picking up an Oscar or three is taking a considerable turn for the better this weekend as the sci-fi thriller heads towards a celestial $55.6 million debut, according to Warner Bros.'s Sunday projection. That will comfortably set a record for the biggest weekend in October, overtaking Paranormal Activity 3's $52.6 million back in 2011. With Captain Phillips and 12 Years a Slave opening in the next two weeks, awards season is getting interesting. More...

2013 Preview: October

October 1st, 2013

October is an awkward month. It sits between the dumping ground that is September and November, the unofficial start of Awards Season / holiday blockbuster season. For the most part, September was stronger than average for the month and there's reason to be optimistic going forward. After all, box office success tends to feed on itself, as does box office struggles. That said, there are not a lot of sure hits over the coming four weeks. Of the nine or ten films opening wide this month, only Gravity has a better than 50/50 chance at $100 million. Captain Phillips could have a shot at the century mark, but only if it becomes a serious Awards Season player. Its early reviews suggest that could be a possibility. Last October, there were two films to reach the $100 million mark, Taken 2 and Argo. On the other hand, pretty much everything else that opened that month crashed and burned. While this October doesn't have as strong a top end, it will hopefully have much better depth. More...

All Acting Credits


Register with The Numbers for free to customize this chart.

Release
Date
TitleRoleDomestic
Box Office
International
Box Office
Worldwide
Box Office
Sep 20, 2024Wolfs
Oct 21, 2022Ticket to Paradise David Cotton $68,275,985$100,300,996$168,576,981
Jan 8, 2021Grizzly II: Revenge
Dec 23, 2020The Midnight Sky Augustine Lofthouse $75,615$75,615
May 1, 2020Never Stop Dreaming: T… Narrator
May 11, 2018Always at the Carlyle Himself $174,251$174,251
Jul 8, 2016Norman Lear: Just Anot… Himself $70,950$70,950
May 13, 2016Money Monster Lee Gates $41,012,075$52,454,020$93,466,095
Feb 5, 2016Hail, Caesar! Baird Whitlock $30,080,225$34,139,971$64,220,196
May 22, 2015Tomorrowland Frank $93,436,322$113,191,196$206,627,518
Feb 7, 2014The Monuments Men Frank Stokes $78,031,620$80,671,128$158,702,748
Oct 4, 2013Gravity Matt Kowalski $274,092,705$410,565,026$684,657,731
Nov 16, 2011The Descendants Matt King $82,624,961$92,882,839$175,507,800
Oct 7, 2011The Ides of March Mike Morris $40,962,534$36,773,391$77,735,925
Sep 1, 2010The American Jack/Edward $35,606,376$32,344,347$67,950,723
Dec 4, 2009Up in the Air Ryan Bingham $83,823,381$83,019,358$166,842,739
Nov 13, 2009Fantastic Mr. Fox Mr. Fox $21,002,919$25,184,592$46,187,511
Nov 6, 2009The Men Who Stare at G… Lyn Cassady $32,428,195$34,920,023$67,348,218
Sep 12, 2008Burn After Reading Harry Pfarrer $60,355,347$107,812,451$168,167,798
Apr 4, 2008Leatherheads Jimmy 'Dodge' Con… $31,373,938$9,974,690$41,348,628
Oct 5, 2007Michael Clayton Michael Clayton $49,033,882$43,953,769$92,987,651
Jun 8, 2007Ocean's Thirteen Danny Ocean $117,144,465$194,600,000$311,744,465
Dec 15, 2006The Good German Jake Geismar $1,308,696$5,369,337$6,678,033
Nov 23, 2005Syriana Bob Barnes $50,824,620$41,866,339$92,690,959
Oct 7, 2005Good Night, and Good Luck Fred Friendly $31,501,218$25,085,683$56,586,901
Dec 10, 2004Ocean's Twelve Danny Ocean $125,531,634$237,457,442$362,989,076
Oct 10, 2003Intolerable Cruelty Miles Massey $35,327,628$86,000,000$121,327,628
Jul 25, 2003Spy Kids 3-D: Game Over Devlin $111,760,631$56,091,364$167,851,995
Dec 31, 2002Confessions of a Dange… CIA Agent Jim Byrd $16,007,718$17,006,087$33,013,805
Nov 27, 2002Solaris Chris Kelvin $14,970,038$14,970,038
Oct 4, 2002Welcome to Collinwood Jerzy $378,650$4,227,634$4,606,284
Dec 7, 2001Ocean's Eleven Danny Ocean $183,417,150$267,311,379$450,728,529
Mar 30, 2001Spy Kids Devlin $112,692,062$85,000,000$197,692,062
Dec 22, 2000O Brother, Where Art T… Everett Ulysses M… $45,506,619$30,257,195$75,763,814
Jun 30, 2000The Perfect Storm Captain Billy Tyne $182,618,434$146,093,000$328,711,434
Oct 1, 1999Three Kings Archie Gates $60,652,036$47,100,000$107,752,036
Jun 30, 1999South Park: Bigger, Lo… Dr. Gouache/Dr. D… $52,037,603$52,037,603
Dec 23, 1998The Thin Red Line Bosche, Charles S… $36,400,491$61,308,543$97,709,034
Jun 26, 1998Out of Sight Jack Foley $37,562,568$40,000,000$77,562,568
Sep 26, 1997The Peacemaker Thomas Devoe $41,263,140$21,704,228$62,967,368
Jun 20, 1997Batman & Robin Batman/Bruce Wayne $107,325,195$130,992,619$238,317,814
Dec 20, 1996One Fine Day Jack Taylor $46,169,663$46,169,663
Jan 19, 1996From Dusk Till Dawn Seth Gecko $25,728,961$7,201$25,736,162
Apr 22, 1988Return of the Killer T…
1987Return to Horror High Oliver $1,190,000$1,190,000
 
Averages $61,492,622$78,735,470$127,206,009
Totals 45 $2,459,704,886$2,755,741,463$5,215,446,349


Leading or Lead Ensemble Roles


Register with The Numbers for free to customize this chart.

Release
Date
TitleOpening
Weekend
Maximum
Theaters
Domestic
Box Office
Worldwide
Box Office
Domestic
Share
Sep 20, 2024Wolfs
Oct 21, 2022Ticket to Paradise $16,509,0954,066$68,275,985$168,576,98140.5%
Jan 8, 2021Grizzly II: Revenge
Dec 23, 2020The Midnight Sky $75,615
May 13, 2016Money Monster $14,788,1573,104$41,012,075$93,466,09543.9%
Feb 5, 2016Hail, Caesar! $11,355,2252,248$30,080,225$64,220,19646.8%
May 22, 2015Tomorrowland $33,028,1653,972$93,436,322$206,627,51845.2%
Feb 7, 2014The Monuments Men $22,003,4333,083$78,031,620$158,702,74849.2%
Oct 4, 2013Gravity $55,785,1123,820$274,092,705$684,657,73140.0%
Nov 16, 2011The Descendants $1,190,0962,038$82,624,961$175,507,80047.1%
Oct 7, 2011The Ides of March $10,470,1432,199$40,962,534$77,735,92552.7%
Sep 1, 2010The American $13,177,7902,833$35,606,376$67,950,72352.4%
Dec 4, 2009Up in the Air $1,181,4502,218$83,823,381$166,842,73950.2%
Nov 13, 2009Fantastic Mr. Fox $265,9002,034$21,002,919$46,187,51145.5%
Nov 6, 2009The Men Who Stare at G… $12,706,6542,453$32,428,195$67,348,21848.2%
Sep 12, 2008Burn After Reading $19,128,0012,657$60,355,347$168,167,79835.9%
Apr 4, 2008Leatherheads $12,682,5952,798$31,373,938$41,348,62875.9%
Oct 5, 2007Michael Clayton $719,9102,585$49,033,882$92,987,65152.7%
Jun 8, 2007Ocean's Thirteen $36,133,4033,565$117,144,465$311,744,46537.6%
Dec 15, 2006The Good German $76,81764$1,308,696$6,678,03319.6%
Nov 23, 2005Syriana $374,5021,775$50,824,620$92,690,95954.8%
Dec 10, 2004Ocean's Twelve $39,153,3803,290$125,531,634$362,989,07634.6%
Oct 10, 2003Intolerable Cruelty $12,525,0752,570$35,327,628$121,327,62829.1%
Nov 27, 2002Solaris $6,752,7222,406$14,970,038$14,970,038100.0%
Dec 7, 2001Ocean's Eleven $38,107,8223,075$183,417,150$450,728,52940.7%
Dec 22, 2000O Brother, Where Art T… $195,104847$45,506,619$75,763,81460.1%
Jun 30, 2000The Perfect Storm $41,325,0423,407$182,618,434$328,711,43455.6%
Oct 1, 1999Three Kings $15,847,6362,943$60,652,036$107,752,03656.3%
Dec 23, 1998The Thin Red Line $223,5481,657$36,400,491$97,709,03437.3%
Jun 26, 1998Out of Sight $12,020,4352,112$37,562,568$77,562,56848.4%
Sep 26, 1997The Peacemaker $12,311,9392,420$41,263,140$62,967,36865.5%
Jun 20, 1997Batman & Robin $42,872,6052,942$107,325,195$238,317,81445.0%
Dec 20, 1996One Fine Day $6,226,4301,975$46,169,663$46,169,663100.0%
Jan 19, 1996From Dusk Till Dawn $10,240,8052,007$25,728,961$25,736,162100.0%
1987Return to Horror High $1,190,000$1,190,000100.0%
 
Averages $16,109,0002,554$66,721,306$142,527,65153.5%
Totals 35 $2,135,081,803$4,703,412,498


Supporting Roles


Register with The Numbers for free to customize this chart.

Release
Date
TitleOpening
Weekend
Maximum
Theaters
Domestic
Box Office
Worldwide
Box Office
Domestic
Share
Oct 7, 2005Good Night, and Good Luck $421,446929$31,501,218$56,586,90155.7%
Jul 25, 2003Spy Kids 3-D: Game Over $33,417,7393,388$111,760,631$167,851,99566.6%
Dec 31, 2002Confessions of a Dange… $87,1991,776$16,007,718$33,013,80548.5%
Oct 4, 2002Welcome to Collinwood $75,18045$378,650$4,606,2848.2%
Mar 30, 2001Spy Kids $26,546,8813,191$112,692,062$197,692,06257.0%
Jun 30, 1999South Park: Bigger, Lo… $14,774,6662,128$52,037,603$52,037,603100.0%
 
Averages $12,553,8521,910$54,062,980$85,298,10856.0%
Totals 6 $324,377,882$511,788,650

Latest Ranking on All Acting Box Office Record Lists


RecordRankAmount
Top 100 Stars in Leading Roles at the Domestic Box Office 79 $2,135,081,803
Top 100 Stars in Supporting Roles at the Domestic Box Office (Rank 4,601-4,700) 4,678 $324,377,882
Top Live Action Stars at the Domestic Box Office (Rank 101-200) 159 $2,386,664,364
Top Above the Line Stars at the Domestic Box Office (Rank 101-200) 143 $2,101,494,185
Top Below the Line Stars at the Domestic Box Office (Rank 9,301-9,400) 9,316 $164,043,435
Top Stars at the Domestic Box Office (Rank 201-300) 229 $2,459,704,886
Top 100 Stars in Leading Roles at the International Box Office 90 $2,568,330,695
Top 100 Stars in Supporting Roles at the International Box Office (Rank 11,701-11,800) 11,764 $187,410,768
Top Live Action Stars at the International Box Office (Rank 201-300) 261 $2,730,556,871
Top Above the Line Stars at the International Box Office (Rank 101-200) 197 $2,570,133,105
Top Below the Line Stars at the International Box Office (Rank 25,101-25,200) 25,162 $56,091,364
Top Stars at the International Box Office (Rank 301-400) 366 $2,755,741,463
Top 100 Stars in Leading Roles at the Worldwide Box Office 82 $4,703,412,498
Top 100 Stars in Supporting Roles at the Worldwide Box Office (Rank 7,401-7,500) 7,408 $511,788,650
Top Live Action Stars at the Worldwide Box Office (Rank 201-300) 208 $5,117,221,235
Top Above the Line Stars at the Wordwide Box Office (Rank 101-200) 171 $4,671,627,290
Top Below the Line Stars at the Worldwide Box Office (Rank 15,701-15,800) 15,761 $220,134,799
Top Stars at the Worldwide Box Office (Rank 301-400) 309 $5,215,446,349
Highest Grossing Stars of 1996 at the Domestic Box Office 67 106
Highest Grossing Stars of 1997 at the Domestic Box Office 15 245
Highest Grossing Stars of 1998 at the Domestic Box Office 5 331
Highest Grossing Stars of 1999 at the Domestic Box Office 8 287
Highest Grossing Stars of 2000 at the Domestic Box Office 15 289
Highest Grossing Stars of 2001 at the Domestic Box Office 5 296
Highest Grossing Stars of 2002 at the Domestic Box Office 13 234
Highest Grossing Stars of 2003 at the Domestic Box Office 89 113
Highest Grossing Stars of 2004 at the Domestic Box Office 95 107
Highest Grossing Stars of 2005 at the Domestic Box Office 47 153
Highest Grossing Stars of 2006 at the Domestic Box Office 51 133
Highest Grossing Stars of 2007 at the Domestic Box Office 32 167
Highest Grossing Stars of 2008 at the Domestic Box Office 26 176
Highest Grossing Stars of 2009 at the Domestic Box Office 7 253
Highest Grossing Stars of 2010 at the Domestic Box Office 62 149
Highest Grossing Stars of 2011 at the Domestic Box Office 41 185
Highest Grossing Stars of 2012 at the Domestic Box Office (Rank 101-200) 102 108
Highest Grossing Stars of 2013 at the Domestic Box Office 42 186
Highest Grossing Stars of 2014 at the Domestic Box Office 56 151
Highest Grossing Stars of 2015 at the Domestic Box Office 18 222
Highest Grossing Stars of 2016 at the Domestic Box Office 43 165
Highest Grossing Stars of 2017 at the Domestic Box Office (Rank 101-200) 113 109
Highest Grossing Stars of 2018 at the Domestic Box Office (Rank 401-500) 482 38
Highest Grossing Stars of 2022 at the Domestic Box Office (Rank 201-300) 232 74
Highest Grossing Stars of 2023 at the Domestic Box Office (Rank 201-300) 288 74
Highest Grossing Stars of 2024 at the Domestic Box Office (Rank 201-300) 240 74
Highest Grossing Stars of 2000 at the International Box Office 6 344
Highest Grossing Stars of 2001 at the International Box Office 5 304
Highest Grossing Stars of 2002 at the International Box Office 10 239
Highest Grossing Stars of 2003 at the International Box Office 43 172
Highest Grossing Stars of 2004 at the International Box Office 40 169
Highest Grossing Stars of 2005 at the International Box Office 19 205
Highest Grossing Stars of 2006 at the International Box Office 54 129
Highest Grossing Stars of 2007 at the International Box Office 35 148
Highest Grossing Stars of 2008 at the International Box Office 19 180
Highest Grossing Stars of 2009 at the International Box Office 8 255
Highest Grossing Stars of 2010 at the International Box Office 59 145
Highest Grossing Stars of 2011 at the International Box Office 70 135
Highest Grossing Stars of 2012 at the International Box Office (Rank 201-300) 271 60
Highest Grossing Stars of 2013 at the International Box Office 57 150
Highest Grossing Stars of 2014 at the International Box Office 62 123
Highest Grossing Stars of 2015 at the International Box Office 30 173
Highest Grossing Stars of 2016 at the International Box Office (Rank 101-200) 164 81
Highest Grossing Stars of 2017 at the International Box Office (Rank 301-400) 310 50
Highest Grossing Stars of 2022 at the International Box Office (Rank 201-300) 212 66
Highest Grossing Stars of 2023 at the International Box Office (Rank 201-300) 249 66
Highest Grossing Stars of 2024 at the International Box Office (Rank 201-300) 220 66
Highest Grossing Stars of 2000 at the Worldwide Box Office 6 337
Highest Grossing Stars of 2001 at the Worldwide Box Office 5 306
Highest Grossing Stars of 2002 at the Worldwide Box Office 9 238
Highest Grossing Stars of 2003 at the Worldwide Box Office 65 151
Highest Grossing Stars of 2004 at the Worldwide Box Office 62 146
Highest Grossing Stars of 2005 at the Worldwide Box Office 29 189
Highest Grossing Stars of 2006 at the Worldwide Box Office 57 134
Highest Grossing Stars of 2007 at the Worldwide Box Office 30 172
Highest Grossing Stars of 2008 at the Worldwide Box Office 21 190
Highest Grossing Stars of 2009 at the Worldwide Box Office 5 267
Highest Grossing Stars of 2010 at the Worldwide Box Office 57 154
Highest Grossing Stars of 2011 at the Worldwide Box Office 45 170
Highest Grossing Stars of 2012 at the Worldwide Box Office (Rank 101-200) 121 93
Highest Grossing Stars of 2013 at the Worldwide Box Office 49 170
Highest Grossing Stars of 2014 at the Worldwide Box Office 54 144
Highest Grossing Stars of 2015 at the Worldwide Box Office 21 207
Highest Grossing Stars of 2016 at the Worldwide Box Office 74 126
Highest Grossing Stars of 2017 at the Worldwide Box Office (Rank 201-300) 212 75
Highest Grossing Stars of 2018 at the Worldwide Box Office (Rank 501-600) 551 12
Highest Grossing Stars of 2022 at the Worldwide Box Office (Rank 201-300) 216 70
Highest Grossing Stars of 2023 at the Worldwide Box Office (Rank 201-300) 263 70
Highest Grossing Stars of 2024 at the Worldwide Box Office (Rank 201-300) 233 70
Top Domestic Leading Stars for Original Screenplay Movies 50 $1,093,821,242
Top Domestic Leading Stars for Based on Fiction Book/Short Story Movies (Rank 101-200) 103 $345,975,831
Top Domestic Leading Stars for Based on Comic/Graphic Novel Movies (Rank 201-300) 231 $107,325,195
Top Domestic Leading Stars for Remake Movies 48 $198,387,188
Top Domestic Leading Stars for Based on Factual Book/Article Movies 20 $301,913,194
Top Domestic Leading Stars for Based on Folk Tale/Legend/Fairytale Movies 91 $45,506,619
Top Domestic Leading Stars for Based on Play Movies 59 $40,962,534
Top International Leading Stars for Original Screenplay Movies 52 $1,469,901,109
Top International Leading Stars for Based on Fiction Book/Short Story Movies (Rank 101-200) 138 $384,626,646
Top International Leading Stars for Based on Comic/Graphic Novel Movies (Rank 201-300) 253 $130,992,619
Top International Leading Stars for Remake Movies 46 $267,311,379
Top International Leading Stars for Based on Factual Book/Article Movies 13 $248,468,356
Top International Leading Stars for Based on Folk Tale/Legend/Fairytale Movies (Rank 101-200) 109 $30,257,195
Top International Leading Stars for Based on Play Movies 30 $36,773,391
Top Worldwide Leading Stars for Original Screenplay Movies 53 $2,563,722,351
Top Worldwide Leading Stars for Based on Fiction Book/Short Story Movies (Rank 101-200) 122 $730,602,477
Top Worldwide Leading Stars for Based on Comic/Graphic Novel Movies (Rank 201-300) 252 $238,317,814
Top Worldwide Leading Stars for Remake Movies 50 $465,698,567
Top Worldwide Leading Stars for Based on Factual Book/Article Movies 18 $550,381,550
Top Worldwide Leading Stars for Based on Folk Tale/Legend/Fairytale Movies (Rank 101-200) 105 $75,763,814
Top Worldwide Leading Stars for Based on Play Movies 36 $77,735,925
Top Domestic Leading Stars for Live Action Movies 29 $2,112,888,884
Top Domestic Leading Stars for Stop-Motion Animation Movies 40 $21,002,919
Top International Leading Stars for Live Action Movies 29 $2,543,146,103
Top International Leading Stars for Stop-Motion Animation Movies 44 $25,184,592
Top Worldwide Leading Stars for Live Action Movies 23 $4,656,034,987
Top Worldwide Leading Stars for Stop-Motion Animation Movies 41 $46,187,511
Top Domestic Leading Stars for Contemporary Fiction Movies 20 $1,405,456,309
Top Domestic Leading Stars for Science Fiction Movies (Rank 201-300) 244 $108,406,360
Top Domestic Leading Stars for Kids Fiction Movies (Rank 701-800) 722 $21,002,919
Top Domestic Leading Stars for Historical Fiction Movies 63 $246,953,134
Top Domestic Leading Stars for Super Hero Movies (Rank 201-300) 209 $107,325,195
Top Domestic Leading Stars for Fantasy Movies (Rank 401-500) 459 $25,728,961
Top Domestic Leading Stars for Dramatization Movies 29 $219,018,925
Top International Leading Stars for Contemporary Fiction Movies 16 $1,883,965,608
Top International Leading Stars for Science Fiction Movies (Rank 201-300) 282 $113,266,811
Top International Leading Stars for Kids Fiction Movies (Rank 601-700) 687 $25,184,592
Top International Leading Stars for Historical Fiction Movies (Rank 101-200) 145 $207,512,321
Top International Leading Stars for Super Hero Movies (Rank 201-300) 209 $130,992,619
Top International Leading Stars for Fantasy Movies (Rank 901-1,000) 926 $7,201
Top International Leading Stars for Dramatization Movies 48 $207,401,543
Top Worldwide Leading Stars for Contemporary Fiction Movies 15 $3,289,421,917
Top Worldwide Leading Stars for Science Fiction Movies (Rank 201-300) 282 $221,673,171
Top Worldwide Leading Stars for Kids Fiction Movies (Rank 701-800) 734 $46,187,511
Top Worldwide Leading Stars for Historical Fiction Movies 93 $454,465,455
Top Worldwide Leading Stars for Super Hero Movies (Rank 201-300) 213 $238,317,814
Top Worldwide Leading Stars for Fantasy Movies (Rank 601-700) 640 $25,736,162
Top Worldwide Leading Stars for Dramatization Movies 43 $426,420,468
Top Domestic Leading Stars for Adventure Movies (Rank 201-300) 229 $336,112,421
Top Domestic Leading Stars for Action Movies (Rank 301-400) 366 $148,588,335
Top Domestic Leading Stars for Comedy Movies (Rank 201-300) 278 $134,152,331
Top Domestic Leading Stars for Drama Movies 20 $569,774,037
Top Domestic Leading Stars for Thriller/Suspense Movies 11 $584,952,926
Top Domestic Leading Stars for Horror Movies (Rank 401-500) 428 $25,728,961
Top Domestic Leading Stars for Romantic Comedy Movies 41 $181,147,214
Top Domestic Leading Stars for Black Comedy Movies 5 $153,435,578
Top International Leading Stars for Adventure Movies (Rank 201-300) 214 $545,324,253
Top International Leading Stars for Action Movies (Rank 401-500) 494 $152,696,847
Top International Leading Stars for Comedy Movies (Rank 201-300) 207 $129,581,758
Top International Leading Stars for Drama Movies 27 $550,071,365
Top International Leading Stars for Thriller/Suspense Movies 9 $804,541,111
Top International Leading Stars for Horror Movies (Rank 1,201-1,300) 1,287 $7,201
Top International Leading Stars for Romantic Comedy Movies 36 $196,275,686
Top International Leading Stars for Black Comedy Movies 10 $189,832,474
Top Worldwide Leading Stars for Adventure Movies (Rank 201-300) 225 $881,436,674
Top Worldwide Leading Stars for Action Movies (Rank 401-500) 455 $301,285,182
Top Worldwide Leading Stars for Comedy Movies (Rank 201-300) 236 $263,734,089
Top Worldwide Leading Stars for Drama Movies 20 $1,119,845,402
Top Worldwide Leading Stars for Thriller/Suspense Movies 11 $1,389,494,037
Top Worldwide Leading Stars for Horror Movies (Rank 501-600) 553 $25,736,162
Top Worldwide Leading Stars for Romantic Comedy Movies 36 $377,422,900
Top Worldwide Leading Stars for Black Comedy Movies 4 $343,268,052
Top Domestic Leading Stars for PG-13 Movies 77 $1,293,695,636
Top Domestic Leading Stars for R Movies 42 $679,587,263
Top Domestic Leading Stars for PG Movies (Rank 401-500) 434 $160,608,904
Top International Leading Stars for PG-13 Movies 91 $1,728,439,061
Top International Leading Stars for R Movies 47 $701,515,846
Top International Leading Stars for PG Movies (Rank 501-600) 510 $138,375,788
Top Worldwide Leading Stars for PG-13 Movies 85 $3,022,134,697
Top Worldwide Leading Stars for R Movies 39 $1,381,103,109
Top Worldwide Leading Stars for PG Movies (Rank 401-500) 474 $298,984,692
Top Domestic Leading Stars for Walt Disney Movies (Rank 301-400) 379 $138,942,941
Top Domestic Leading Stars for Warner Bros. Movies 9 $1,151,948,817
Top Domestic Leading Stars for Universal Movies (Rank 101-200) 145 $202,620,344
Top Domestic Leading Stars for Sony Pictures Movies (Rank 101-200) 141 $160,006,229
Top Domestic Leading Stars for Paramount Pictures Movies (Rank 301-400) 319 $83,823,381
Top Domestic Leading Stars for 20th Century Fox Movies (Rank 201-300) 207 $118,543,111
Top International Leading Stars for Walt Disney Movies (Rank 301-400) 393 $143,448,391
Top International Leading Stars for Warner Bros. Movies 10 $1,525,308,911
Top International Leading Stars for Universal Movies (Rank 101-200) 157 $270,415,657
Top International Leading Stars for Sony Pictures Movies (Rank 101-200) 144 $169,898,539
Top International Leading Stars for Paramount Pictures Movies (Rank 201-300) 297 $83,019,358
Top International Leading Stars for 20th Century Fox Movies (Rank 301-400) 306 $86,493,135
Top Worldwide Leading Stars for Walt Disney Movies (Rank 301-400) 380 $282,391,332
Top Worldwide Leading Stars for Warner Bros. Movies 10 $2,677,257,728
Top Worldwide Leading Stars for Universal Movies (Rank 101-200) 140 $473,036,001
Top Worldwide Leading Stars for Sony Pictures Movies (Rank 101-200) 137 $329,904,768
Top Worldwide Leading Stars for Paramount Pictures Movies (Rank 301-400) 320 $166,842,739
Top Worldwide Leading Stars for 20th Century Fox Movies (Rank 201-300) 277 $205,036,246

All Technical Credits


Register with The Numbers for free to customize this chart.

Release
Date
TitleRoleDomestic
Box Office
International
Box Office
Worldwide
Box Office
Sep 20, 2024Wolfs Producer
Dec 25, 2023The Boys in the Boat Director
Producer
$52,641,306$2,796,301$55,437,607
Oct 21, 2022Ticket to Paradise Producer $68,275,985$100,300,996$168,576,981
Dec 17, 2021The Tender Bar Director
Producer
Dec 23, 2020The Midnight Sky Director
Producer
$75,615$75,615
Dec 16, 2020The Art of Political Murder Producer
Oct 27, 2017Suburbicon Director
Producer
Screenwriter
$5,775,178$9,746,441$15,521,619
May 13, 2016Money Monster Producer $41,012,075$52,454,020$93,466,095
Oct 30, 2015Our Brand is Crisis Producer $7,002,261$1,592,297$8,594,558
Feb 7, 2014The Monuments Men Director
Screenwriter
Producer
$78,031,620$80,671,128$158,702,748
Dec 25, 2013August: Osage County Producer $37,738,810$13,000,000$50,738,810
Oct 12, 2012Argo Producer $136,025,503$91,115,254$227,140,757
Oct 7, 2011The Ides of March Director
Producer
Screenwriter
$40,962,534$36,773,391$77,735,925
Sep 1, 2010The American Producer $35,606,376$32,344,347$67,950,723
Sep 18, 2009The Informant! Executive Producer $33,316,821$8,454,347$41,771,168
Apr 4, 2008Leatherheads Director $31,373,938$9,974,690$41,348,628
Oct 5, 2007Michael Clayton Executive Producer $49,033,882$43,953,769$92,987,651
Jul 7, 2006A Scanner Darkly Executive Producer $5,501,616$1,903,468$7,405,084
Dec 25, 2005Rumor Has It Executive Producer $42,996,140$45,937,422$88,933,562
Nov 23, 2005Syriana Executive Producer $50,824,620$41,866,339$92,690,959
Oct 7, 2005Good Night, and Good Luck Director
Screenplay by
$31,501,218$25,085,683$56,586,901
Dec 31, 2002Confessions of a Dangerous … Director $16,007,718$17,006,087$33,013,805
May 24, 2002Insomnia Executive Producer $67,263,182$46,359,317$113,622,499
Sep 7, 2001Rock Star Executive Producer $16,991,902$2,325,863$19,317,765
 
Averages $42,394,134$31,606,513$71,981,879
Totals 24 $847,882,685$663,736,775$1,511,619,460


Director Credits


Register with The Numbers for free to customize this chart.

Release
Date
TitleOpening
Weekend
Maximum
Theaters
Domestic
Box Office
Worldwide
Box Office
Domestic
Share
Dec 25, 2023The Boys in the Boat $8,400,5482,687$52,641,306$55,437,60795.0%
Dec 17, 2021The Tender Bar
Dec 23, 2020The Midnight Sky $75,615
Oct 27, 2017Suburbicon $2,840,2462,046$5,775,178$15,521,61937.2%
Feb 7, 2014The Monuments Men $22,003,4333,083$78,031,620$158,702,74849.2%
Oct 7, 2011The Ides of March $10,470,1432,199$40,962,534$77,735,92552.7%
Apr 4, 2008Leatherheads $12,682,5952,798$31,373,938$41,348,62875.9%
Oct 7, 2005Good Night, and Good Luck $421,446929$31,501,218$56,586,90155.7%
Dec 31, 2002Confessions of a Dange… $87,1991,776$16,007,718$33,013,80548.5%
 
Averages $8,129,3732,217$36,613,359$54,802,85659.2%
Totals 9 $256,293,512$438,422,848


Producer Credits


Register with The Numbers for free to customize this chart.

Release
Date
TitleOpening
Weekend
Maximum
Theaters
Domestic
Box Office
Worldwide
Box Office
Domestic
Share
Sep 20, 2024Wolfs
Dec 25, 2023The Boys in the Boat $8,400,5482,687$52,641,306$55,437,60795.0%
Oct 21, 2022Ticket to Paradise $16,509,0954,066$68,275,985$168,576,98140.5%
Dec 17, 2021The Tender Bar
Dec 23, 2020The Midnight Sky $75,615
Dec 16, 2020The Art of Political M…
Oct 27, 2017Suburbicon $2,840,2462,046$5,775,178$15,521,61937.2%
May 13, 2016Money Monster $14,788,1573,104$41,012,075$93,466,09543.9%
Oct 30, 2015Our Brand is Crisis $3,249,2422,202$7,002,261$8,594,55881.5%
Feb 7, 2014The Monuments Men $22,003,4333,083$78,031,620$158,702,74849.2%
Dec 25, 2013August: Osage County $179,3022,411$37,738,810$50,738,81074.4%
Oct 12, 2012Argo $19,458,1093,247$136,025,503$227,140,75759.9%
Oct 7, 2011The Ides of March $10,470,1432,199$40,962,534$77,735,92552.7%
Sep 1, 2010The American $13,177,7902,833$35,606,376$67,950,72352.4%
 
Averages $11,107,6072,788$50,307,165$83,994,67658.7%
Totals 14 $503,071,648$923,941,438


Writer Credits


Register with The Numbers for free to customize this chart.

Release
Date
TitleOpening
Weekend
Maximum
Theaters
Domestic
Box Office
Worldwide
Box Office
Domestic
Share
Oct 27, 2017Suburbicon $2,840,2462,046$5,775,178$15,521,61937.2%
Feb 7, 2014The Monuments Men $22,003,4333,083$78,031,620$158,702,74849.2%
Oct 7, 2011The Ides of March $10,470,1432,199$40,962,534$77,735,92552.7%
Oct 7, 2005Good Night, and Good Luck $421,446929$31,501,218$56,586,90155.7%
 
Averages $8,933,8172,064$39,067,638$77,136,79848.7%
Totals 4 $156,270,550$308,547,193