Weekend projections: Ebenezer wins weekend as Johnny Depp fans show up over the weekend
November 15, 2026
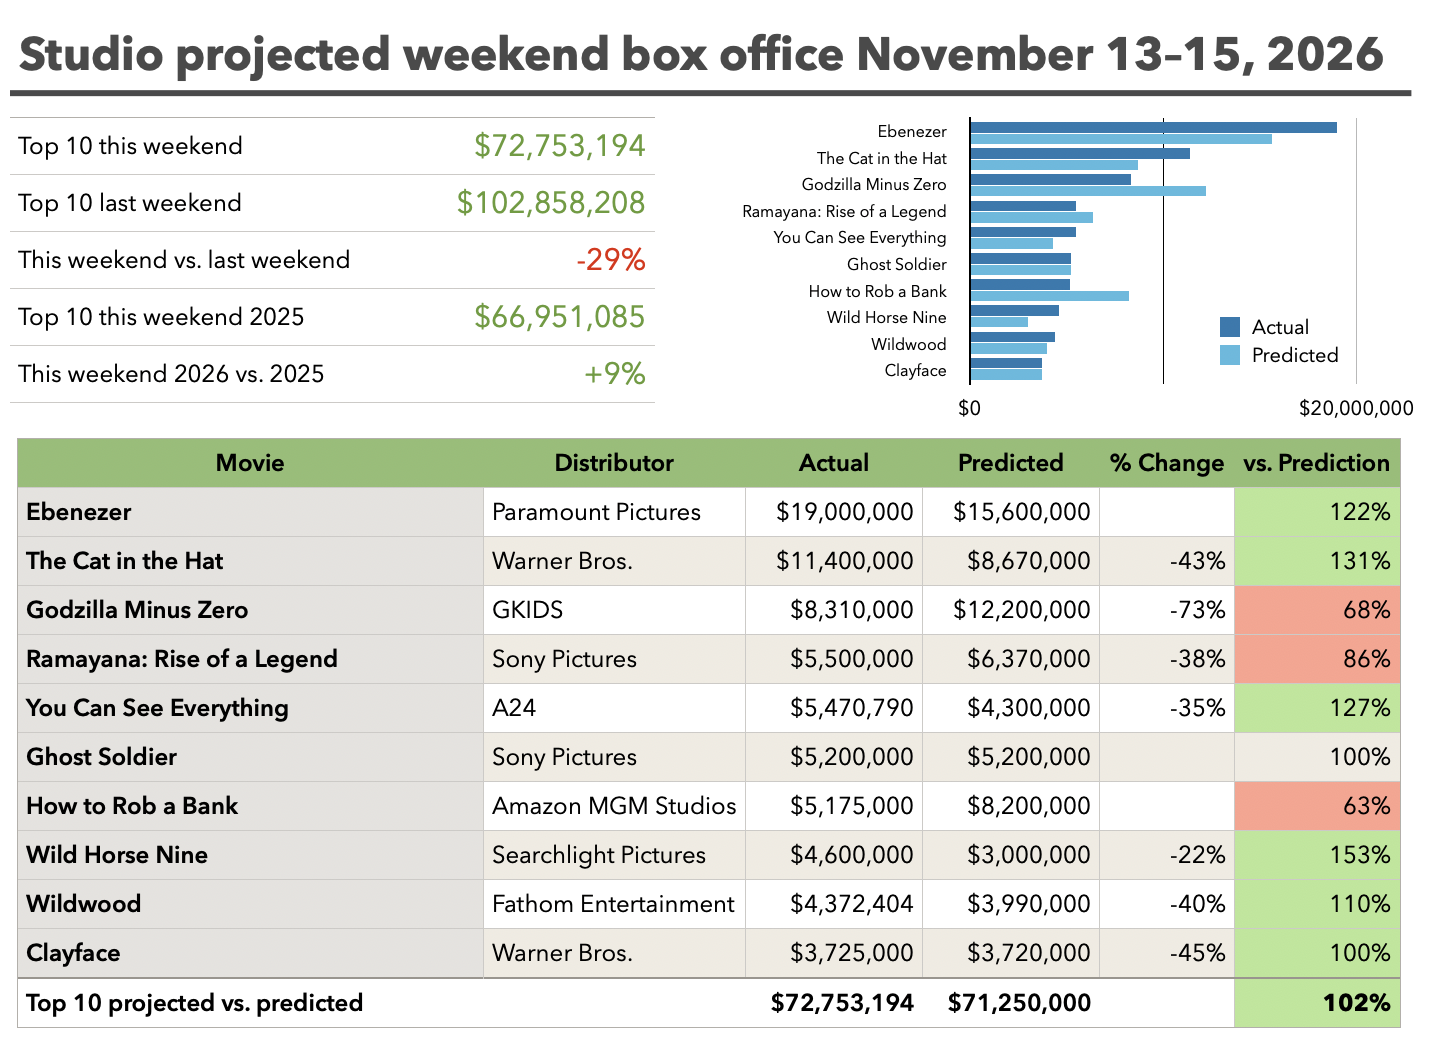
Ebenezer is expected to open with $19.0 million, according to Paramount’s Sunday-morning projection, 22% more than we predicted on Friday and comfortably enough for first place. With $23 million from 63 international markets, it should also top the global chart, with $42 million worldwide. The Cat in the Hat should hold second with $11.4 million, down only 43%, while Godzilla Minus Zero falls 73% and the weekend’s action and horror openers fall well short.
Here are the official studio projections for the weekend (click the image for a full chart of all films reporting so far).
Ebenezer took $6.7 million on Friday, including $1.5 million from Thursday previews, and $7.2 million on Saturday, up 7%, or 38% once the previews are set aside. Paramount expects $5.1 million on Sunday. That is a little below the $20.0 million it projected on Saturday morning, but the weekend would still come to almost 13 times the previews, against a median of 8.83 times for the adult-oriented releases we compared it with on Friday. The audience is not the family crowd its Saturday suggested: only 9% came as families, 59% were over 30, and 51% named Johnny Depp as a reason for going. They liked what they saw, giving it an A- CinemaScore and 4.5 stars on PostTrak, and it is playing best in the South. Abroad, it opened at number one in the UK with $5.4 million, in Italy with $2.0 million and in Mexico with $1.7 million, and second in France, with $2.5 million, and Germany, with $1.5 million.
The Cat in the Hat more than doubled on Saturday, to $5.4 million, and Warner Bros. expects $3.5 million on Sunday, for $38.2 million to date. That is 31% more than we predicted on Friday and 21% more than our Saturday-morning figure, the second weekend running that its Saturday has outrun our numbers by about a fifth. It added $5.6 million abroad, down 44%, for $17.6 million internationally and $55.8 million worldwide, with Mexico its biggest market at $2.1 million. Godzilla Minus Zero rose 77% on Saturday, and GKIDS projects $8.3 million, 32% below our prediction, for $48.9 million. Its fans came out in the first week. IMAX screens should contribute $1.6 million, about a fifth of the weekend, down from two-fifths last weekend, as it shares the format with other films. Globally, it has taken $32 million in IMAX alone.
Ramayana: Rise of a Legend is projected at $5.5 million domestically, down 38% and 14% below our prediction, for $24.1 million, which Sony says makes it the second-biggest Indian film at the US box office. The bigger story is overseas. Its $32.6 million international weekend leads the world outside North America, and Sony reports $147.5 million worldwide after 11 days, already the seventh-biggest total for an Indian film. India accounts for $97.2 million, including $23.6 million (₹223 crore) this weekend, the best second weekend there on record.
Sony projects $5.2 million for Ghost Soldier and $8.3 million for its five days since opening on Veterans Day, both exactly as we predicted. It rose 39% on Saturday, to $2.2 million, but showed no sign of the climb that turned Sound of Freedom’s first weekend into a breakout. Its audience is happy with it, with a 90% audience score on Rotten Tomatoes and 4.5 stars on PostTrak.
Amazon MGM projects $5.2 million for How to Rob a Bank, up from $4.7 million on Saturday morning but still 37% below our prediction. It fell 20% on Saturday, to $1.8 million, although that is a 34% rise once its $900,000 in previews is set aside. The audience was young, 63% of it aged 18 to 34, and gave it a B- CinemaScore, which suggests it will fade quickly. It took $5.1 million from 73 international markets, led by France with $460,000, for $10.3 million worldwide.
Bleecker Street’s Victorian Psycho is expected to take $1.1 million from 1,206 theaters, $897 per theater and 78% below our prediction. Its Saturday was up 10% on Friday’s regular screenings, so some of Friday’s gross came from previews, but strong reviews have not brought out a horror audience.
A24 projects $5.47 million for You Can See Everything, down 35% despite losing 628 theaters and 27% more than we predicted, which would take it to $89.0 million.
Searchlight projects $4.6 million for Wild Horse Nine, down 22% after expanding from 1,100 theaters to 2,175, the best hold in the top ten. That is a little short of the $5 million I expected, although well ahead of the model’s prediction, which struggled to take into account its unusual increase in theaters in its second weekend. It added $5.4 million from 35 international markets, including new openings in Germany and Spain, for $14.7 million internationally and $28.0 million worldwide; the UK leads with $3.8 million. Fathom projects $4.37 million for Laika’s Wildwood, down 40% and 10% more than we predicted, for $48.3 million. Clayface rounds out the top ten with $3.7 million, down 45% and right on our prediction, for $63.6 million. It added $3.3 million abroad, for $57.7 million internationally and $121.3 million worldwide, led by the UK with $9.1 million.
Just outside the top ten, Angel Studios projects $3.5 million for Drummer Boy, down 62%, for $16.2 million. Black Bear expects $1.5 million for Wicker, down 56%, for $23.3 million, and $2.3 million from 17 international markets, for $36.7 million worldwide. Paramount’s Street Fighter is projected at $760,000, for $59.1 million, and passes $100 million worldwide with $41.7 million internationally. Heart of the Beast is projected at $550,000, for $68.3 million, and added $2.0 million abroad, for $192.9 million worldwide.
Variance Films opened God With Us, Jimmy Jenkins’ modern-day parable, as a three-showtime event in 432 theaters, and expects $885,000, a $2,049 average, mostly without evening shows on Saturday or Sunday. After 87 sell-outs, it has been extended through the holiday season.
In limited release, NEON’s Paper Tiger should take $215,009 from six theaters, a $35,835 average that is the best of the weekend. A24’s Club Kid expanded from six theaters to 27 and is projected at $756,060, a $28,002 average, for $1.45 million, ahead of a nationwide release at Thanksgiving. Amazon MGM’s I Play Rocky is expected to take $503,818 from 29, an average of $17,373, before going wide on November 20.
The top ten should total $72.8 million, 2% more than we predicted for the same ten films on Friday and 3% more than our Saturday-morning figure. That is down 29% from last weekend’s $102.9 million and 9% ahead of the same weekend in 2025. Ebenezer, The Cat in the Hat and You Can See Everything are making up for what Godzilla Minus Zero, How to Rob a Bank and Victorian Psycho are missing. Actuals follow on Monday.
As usual, we’ll post numbers as soon as we receive them through the week, and, if you need a head start on the numbers for upcoming movies, The Numbers Business Report has predictions and tracking for all movies coming up in the next 12 months, and our weekly subscription option puts you first in line for our detailed weekend predictions on Friday morning.
Weekend update: Ebenezer shows some signs of life as families start showing up on Friday
November 14, 2026
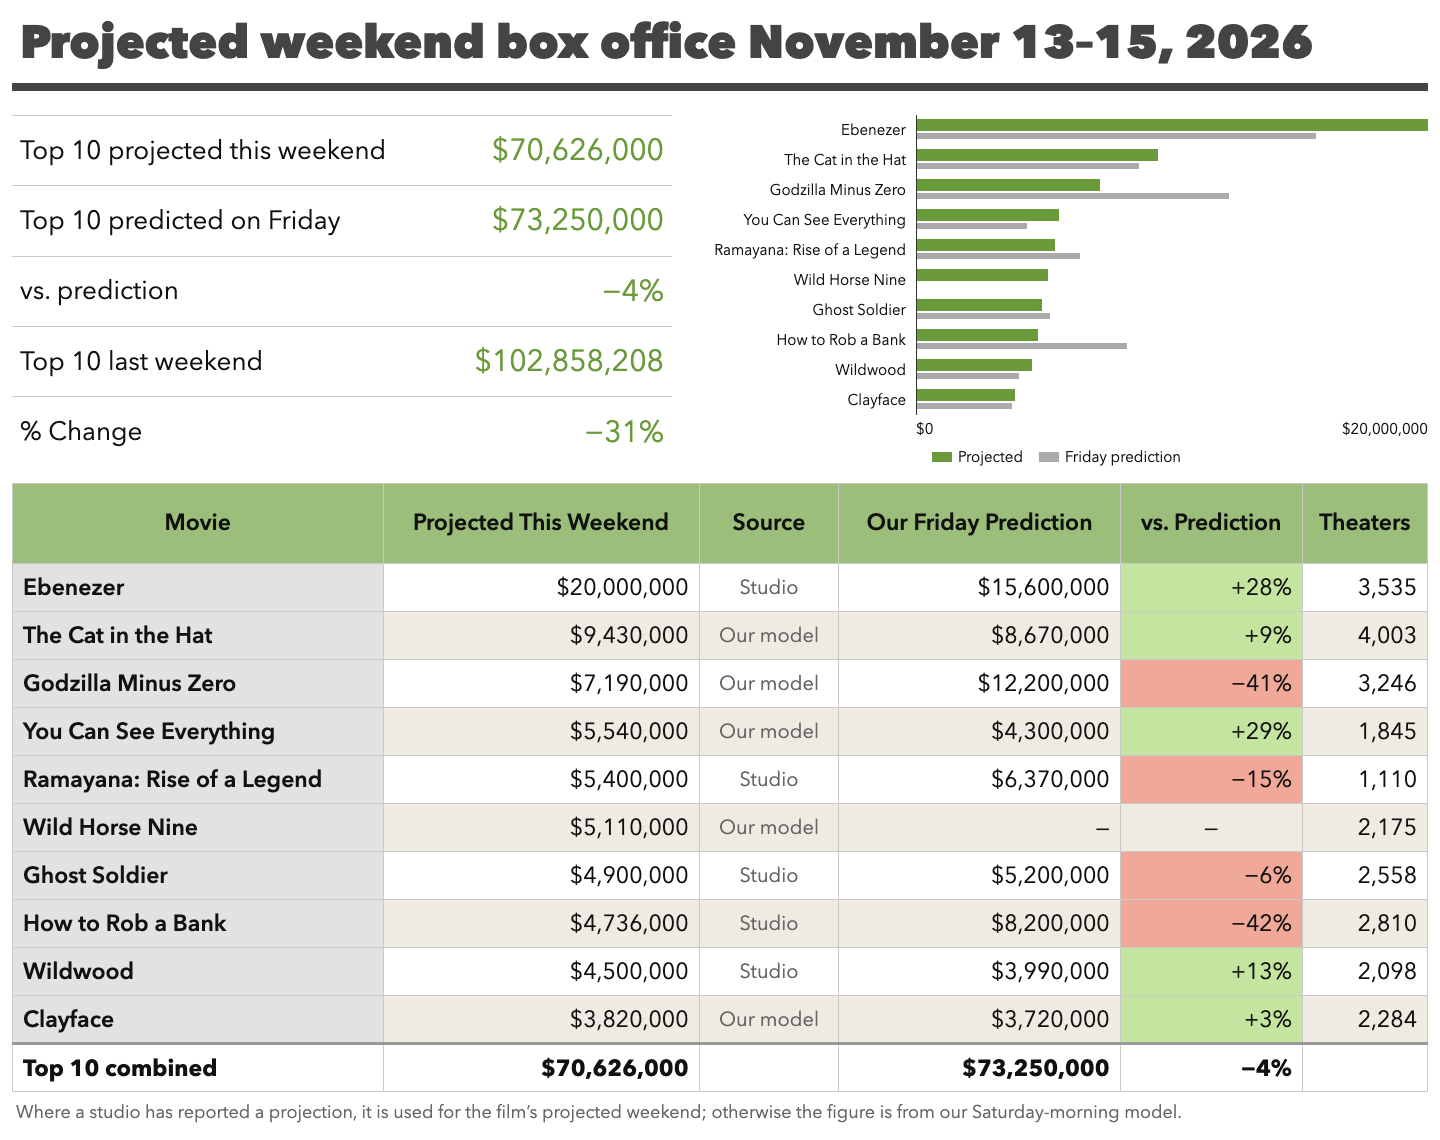
Ebenezer is looking a little stronger than expected this morning after it took $6.7 million on Friday, including $1.5 million from Thursday previews. Paramount expects $20.0 million for the weekend, 28% more than we predicted and comfortably enough for first place. The Cat in the Hat should take second with about $9.4 million, while Godzilla Minus Zero is fading fast, to around $7.2 million, and the weekend’s other openers are well short of expectations. The top ten should take about $70.6 million, 4% less than our Friday-morning prediction, down 31% from last weekend and 5% ahead of the same weekend in 2025.
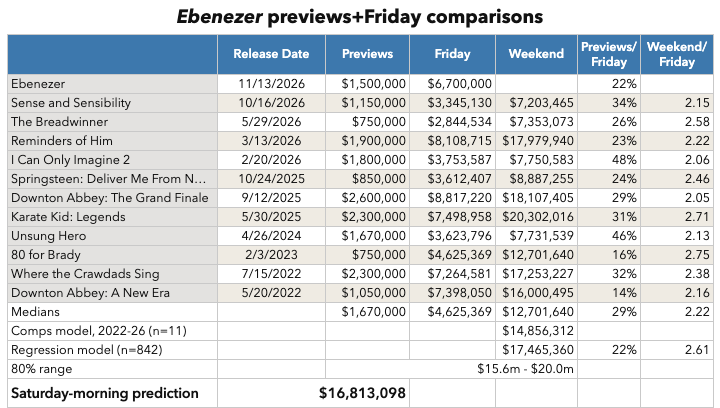
Previews made up 22% of Ebenezer’s Friday, lower than for all but two of the adult-oriented releases it is compared with, so its audience did not all turn out on Thursday night. Those films took a median of 2.22 times their Friday over the weekend, which gives $14.9 million, and the model gives $17.5 million, so our Saturday figure is $16.8 million. Paramount’s $20.0 million is three times Friday, at the very top of our range, which would need a strong Saturday from the family audience coming out for a Christmas story in the daytime. Either way, the PG-13 film is running well ahead of its previews, which pointed to about $13 million.
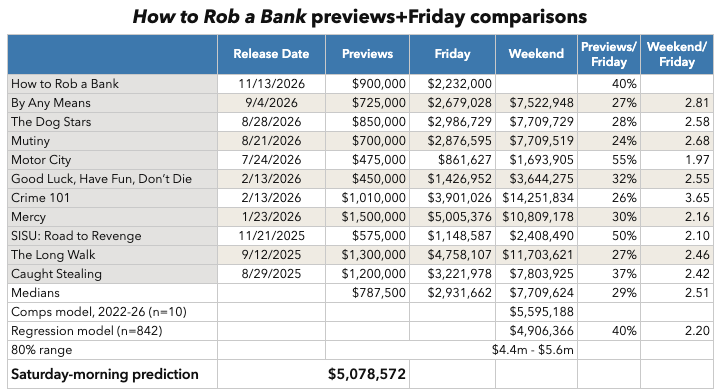
How to Rob a Bank is heading the other way. It took $2.2 million on Friday, and $900,000 of that came from previews, a 40% share. Only two of the action thrillers it is compared with were more front-loaded, Motor City and SISU: Road to Revenge, and both took barely twice their Friday over the weekend. The comparable films give $5.6 million and the model $4.9 million, and Amazon MGM’s projection of $4.7 million is close to the model and 42% below our prediction. David Leitch’s fans turned out on opening night, and few others have followed.
Sony projects $4.9 million for Ghost Soldier and $8.0 million for its five days since opening on Veterans Day, 6% and 4% below our predictions. It took $1.55 million on Friday, up 93% from Thursday, about the rise we expected for a Wednesday opener on an ordinary weekend, but not the climb that turned Sound of Freedom’s first weekend into a breakout. Sony reports a 90% audience score on Rotten Tomatoes and a four-star PostTrak rating.
Bleecker Street’s Victorian Psycho took $463,856 from 1,206 theaters, $385 per theater. No previews were reported, and the model points to about $1.1 million, outside the top ten and far below our model’s pre-release prediction of $5.0 million. Good reviews have not yet brought out a horror audience.
Godzilla Minus Zero took $2.1 million on Friday, down 86% from an opening day that included $6.7 million from previews and early-access screenings, and down 73% without them. A typical second weekend gives $7.2 million, down 77%, which would be 41% below our prediction and take it to about $47.8 million. Its fans came out in the first week. Meanwhile, The Cat in the Hat fell 57% on Friday, to $2.6 million, and a typical second weekend for an animated film gives $9.4 million, down 53%, for $36.2 million.
You Can See Everything lost 628 theaters and still took $1.55 million on Friday, down 39%. A typical fifth weekend gives $5.5 million, down 34% and 29% more than the model predicted, for about $89.1 million. Sony projects $5.4 million for Ramayana: Rise of a Legend, down 40%, and $24.0 million to date, which Sony says will make it the second-biggest Indian film at the North American box office.
Wild Horse Nine took $1.5 million on Friday after expanding from 1,100 theaters to 2,175. That is down 41% from its opening day, but only 9% once last week’s $900,000 in previews is set aside. The model gives $5.1 million, down 13%, for sixth place and about $13.8 million, in line with the $5 million we expected once the expansion was taken into account.
Fathom is projecting $4.5 million for Laika’s Wildwood, down 38%, which would take it to about $48.4 million. Clayface took $1.1 million on Friday, down 46%, which points to $3.8 million, down 43% and close to our prediction, for $63.7 million and tenth place. Warner Bros. reports $55.6 million internationally, for $116.6 million worldwide through Friday.
Angel Studios’ Drummer Boy fell 71% on Friday, to $1.0 million from 2,528 theaters, and a typical second weekend gives $3.5 million, down 63%, which would leave it just outside the top ten. Black Bear is projecting $1.4 million for Wicker, for $23.2 million, and Fathom $850,000 for Jimmy. Paramount has Street Fighter at $700,000, down 67%, for $59.0 million, and Heart of the Beast at $520,000, for $68.3 million. A24’s Club Kid took $266,794 from 27 theaters on Friday, $9,881 per theater, for $963,563 so far.
The top ten should take about $70.6 million between them, 4% less than the $73.3 million we predicted, down 31% from last weekend’s $102.9 million and 5% ahead of the same weekend in 2025. Ebenezer and You Can See Everything are making up much of what Godzilla Minus Zero and the new action and horror films are missing.
Studio projections for the full weekend will follow on Sunday.
Weekend predictions: Ebenezer should top the weekend with weak $15-million or so opening
November 13, 2026
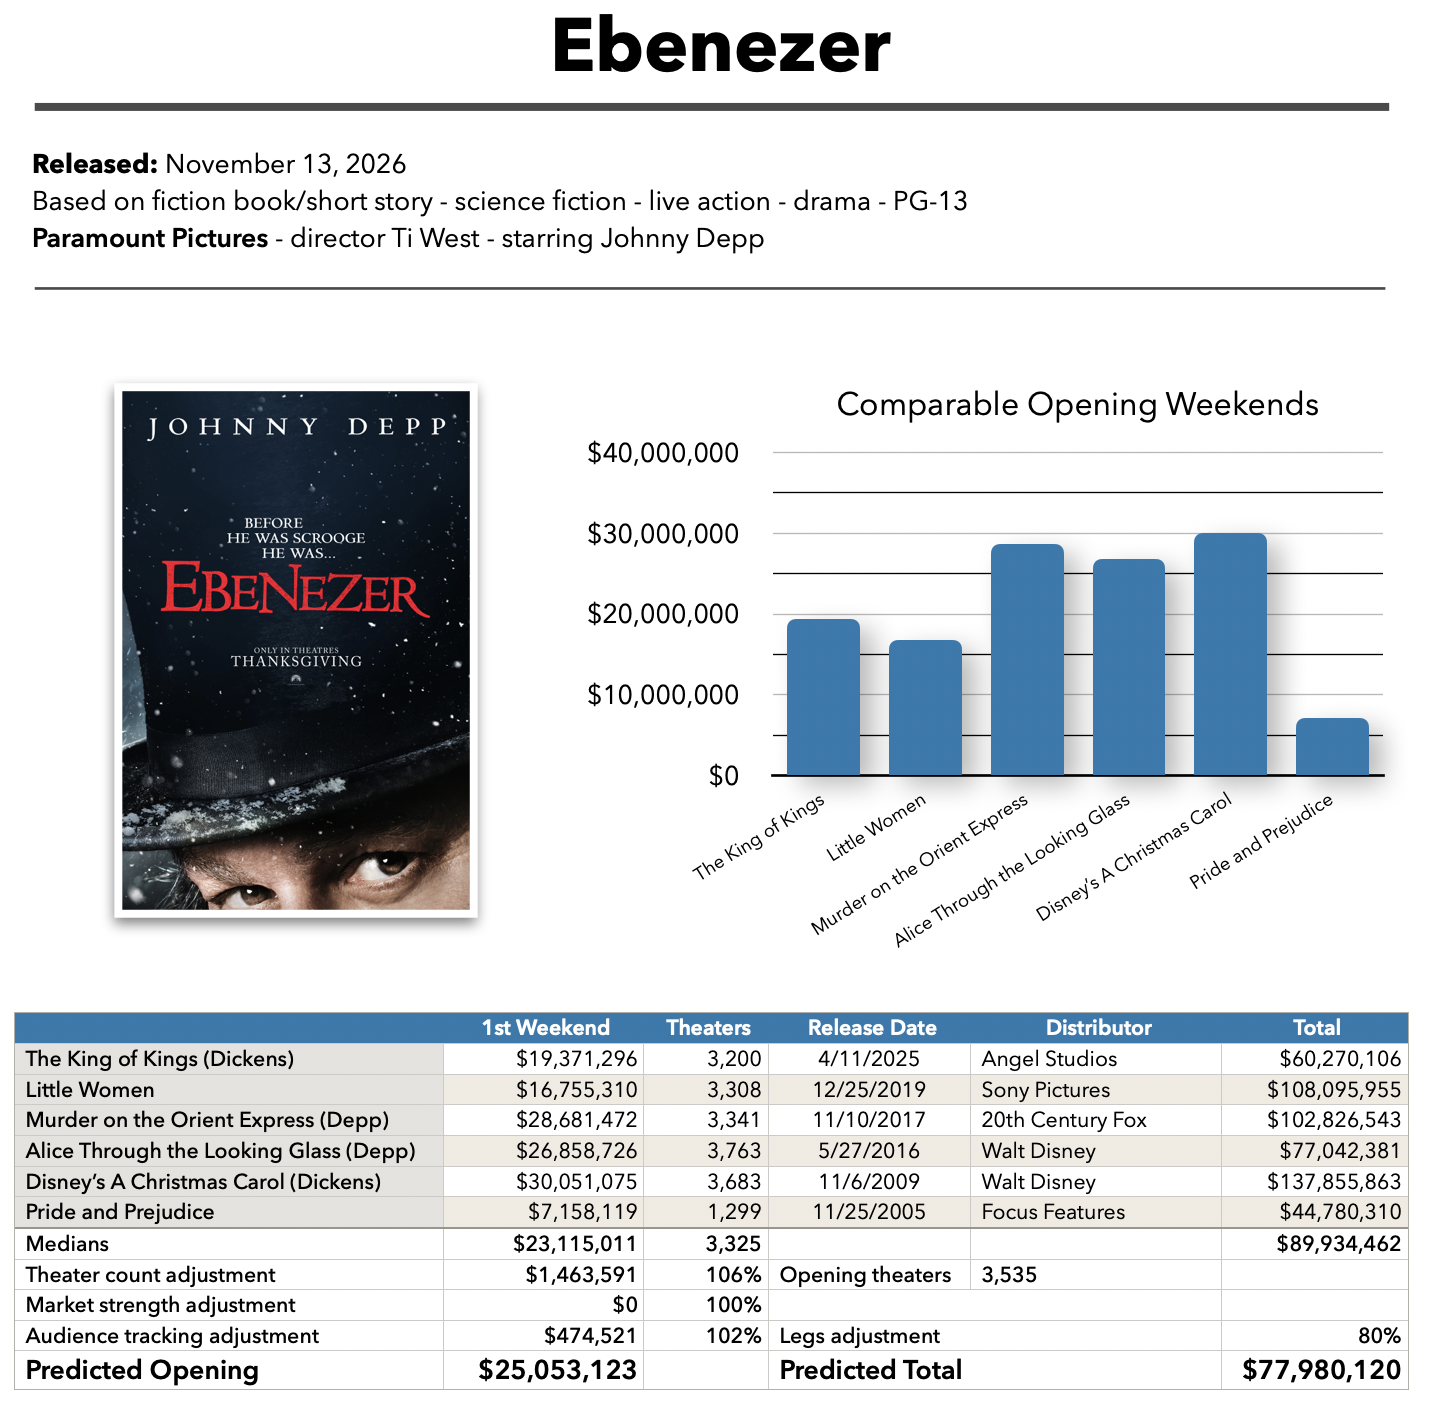
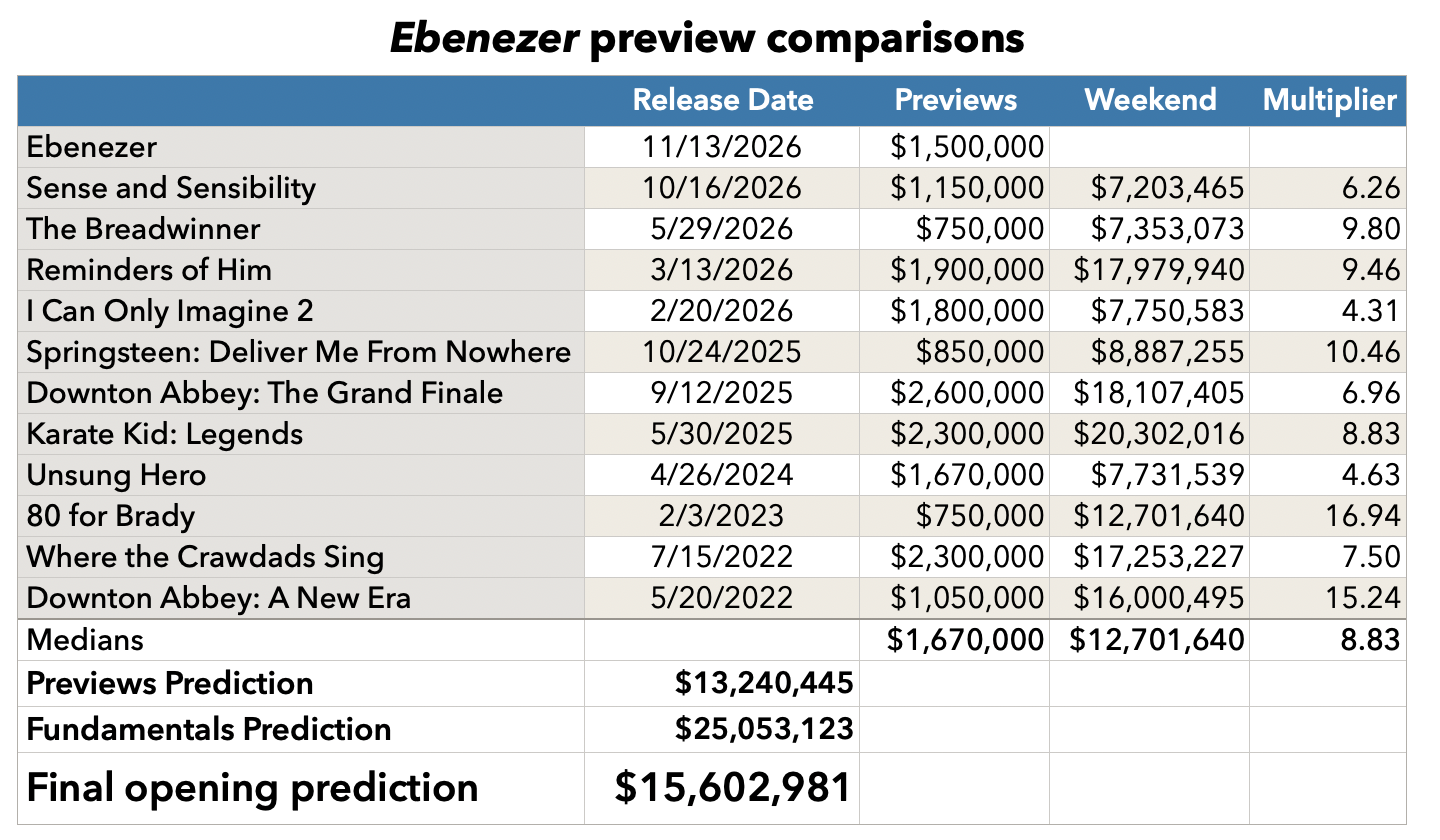
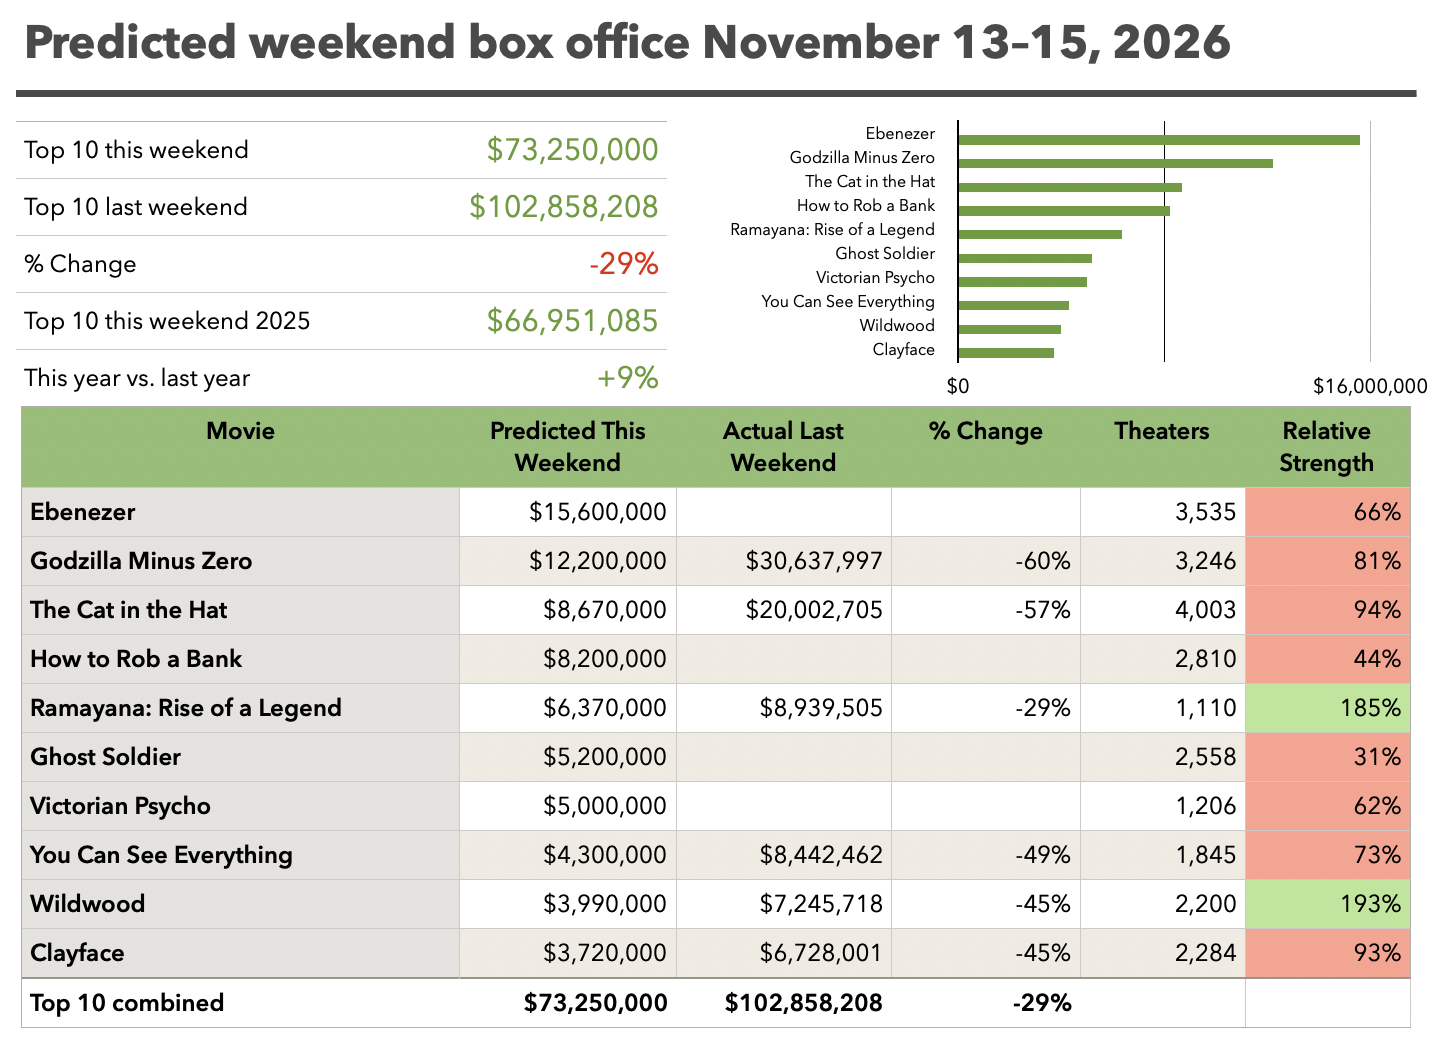
Paramount’s Ebenezer is expected to open with $15.6 million, per our Friday-morning prediction, enough to lead a weekend with four new releases. Godzilla Minus Zero should take second with $12.2 million in its second weekend, and The Cat in the Hat and Amazon MGM’s How to Rob a Bank are close behind, at $8.67 million and $8.2 million. The top ten is predicted at $73.3 million, down 29% from last weekend but 9% ahead of the same weekend in 2025.
Paramount opens Ebenezer in 3,535 theaters. Ti West directs Johnny Depp as Ebenezer Scrooge in a supernatural take on Charles Dickens, with Rupert Grint, Andrea Riseborough, Sam Claflin and Daisy Ridley in the cast.
Depp’s recent wide releases and earlier Dickens adaptations are the natural comparisons. Murder on the Orient Express opened with $28.7 million on this weekend in 2017, and Alice Through the Looking Glass with $26.9 million in 2016. Disney’s A Christmas Carol took $30.1 million in November 2009, and Angel Studios’ animated The King of Kings, in which Dickens tells the story of Jesus to his son, $19.4 million last year. With the period dramas Little Women and Pride and Prejudice, the median is $23.1 million. Ebenezer opens in slightly more theaters than the typical comparison, and tracking is about in line, which gives a baseline of $25.1 million.
Thursday previews of $1.5 million point to a much smaller start. Recent releases aimed at adult audiences turned their previews into openings at a median of 8.83 times, among them Downton Abbey: The Grand Finale, which took $2.6 million on Thursday and $18.1 million for the weekend, and 80 for Brady, whose 16.94 is the highest in the group. That gives $13.2 million, little more than half the baseline. Our prediction of $15.6 million leans toward the previews, and would still be enough for first place.
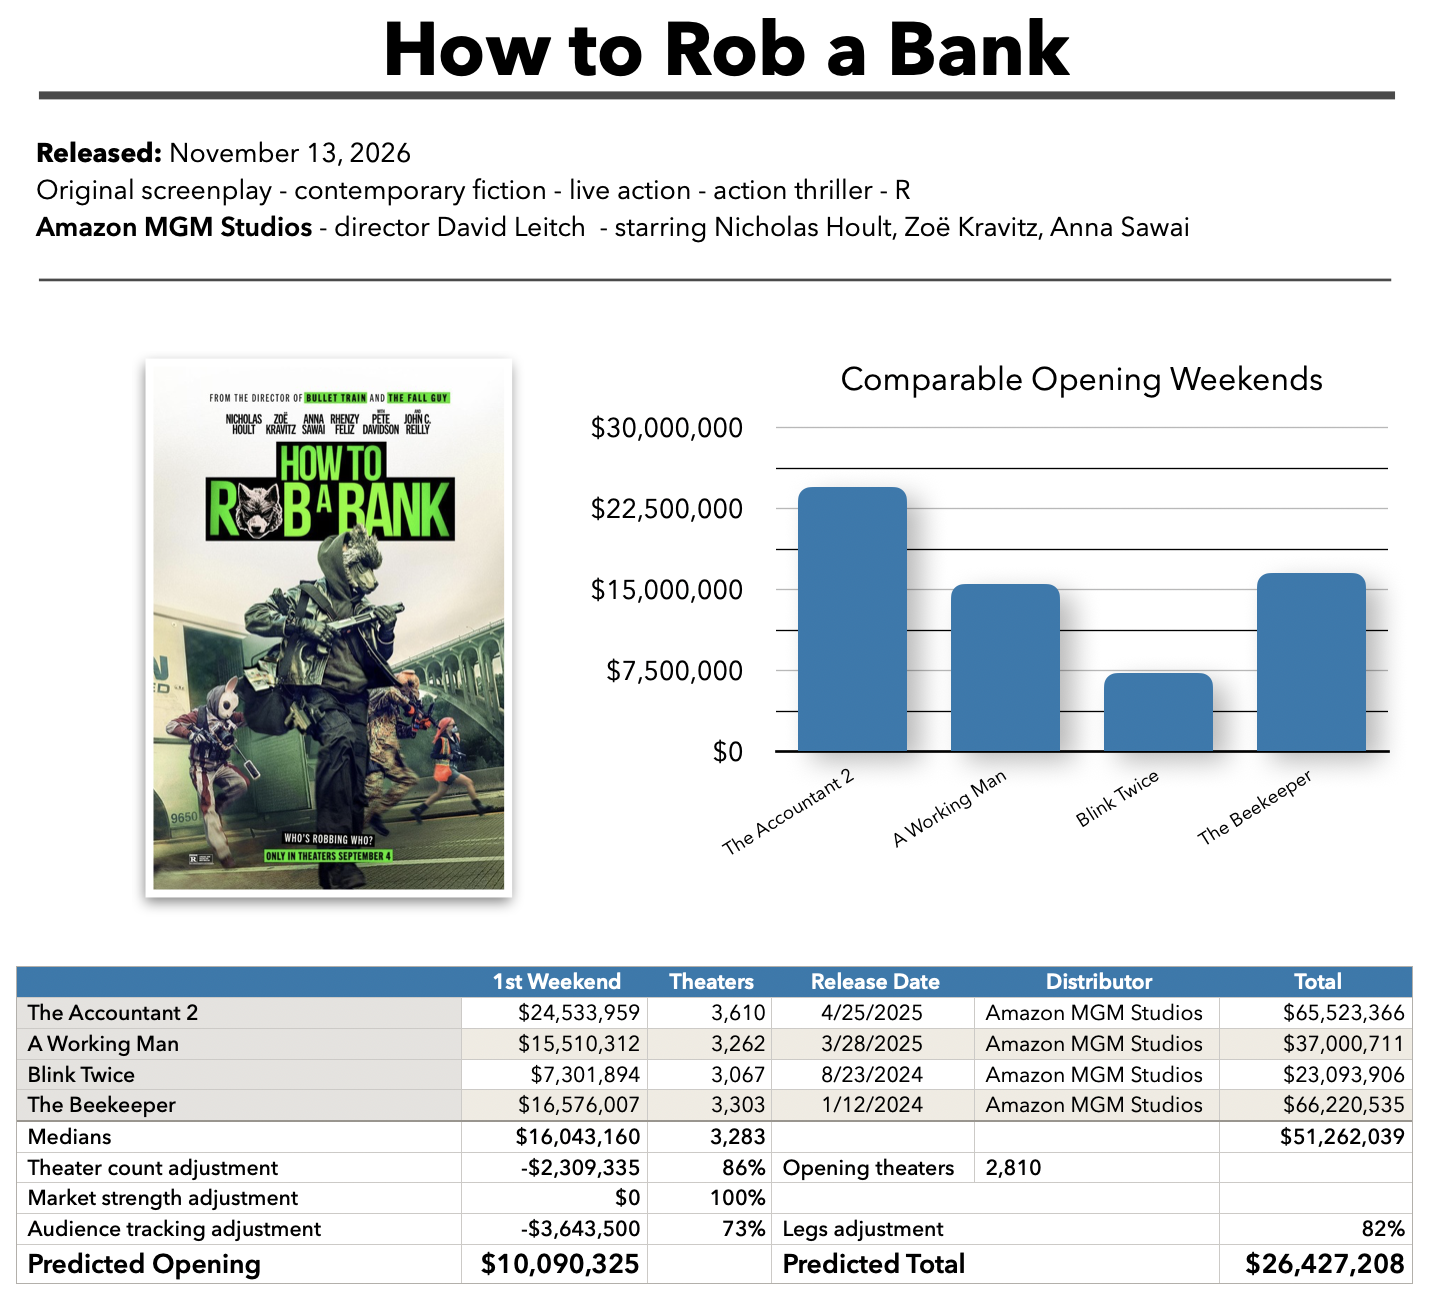
Amazon MGM opens How to Rob a Bank in 2,810 theaters. David Leitch, director of Bullet Train and The Fall Guy, directs the heist thriller, with Nicholas Hoult, Zoë Kravitz, Anna Sawai, Rhenzy Feliz, Pete Davidson and John C. Reilly in the cast.
Amazon MGM’s own action releases give a median opening of $16.0 million, from The Accountant 2 at $24.5 million, through The Beekeeper and A Working Man, at $16.6 million and $15.5 million, down to Blink Twice at $7.3 million. How to Rob a Bank opens in about 470 fewer theaters than the typical comparison, and tracking is running 27% behind, which brings the baseline to $10.1 million.
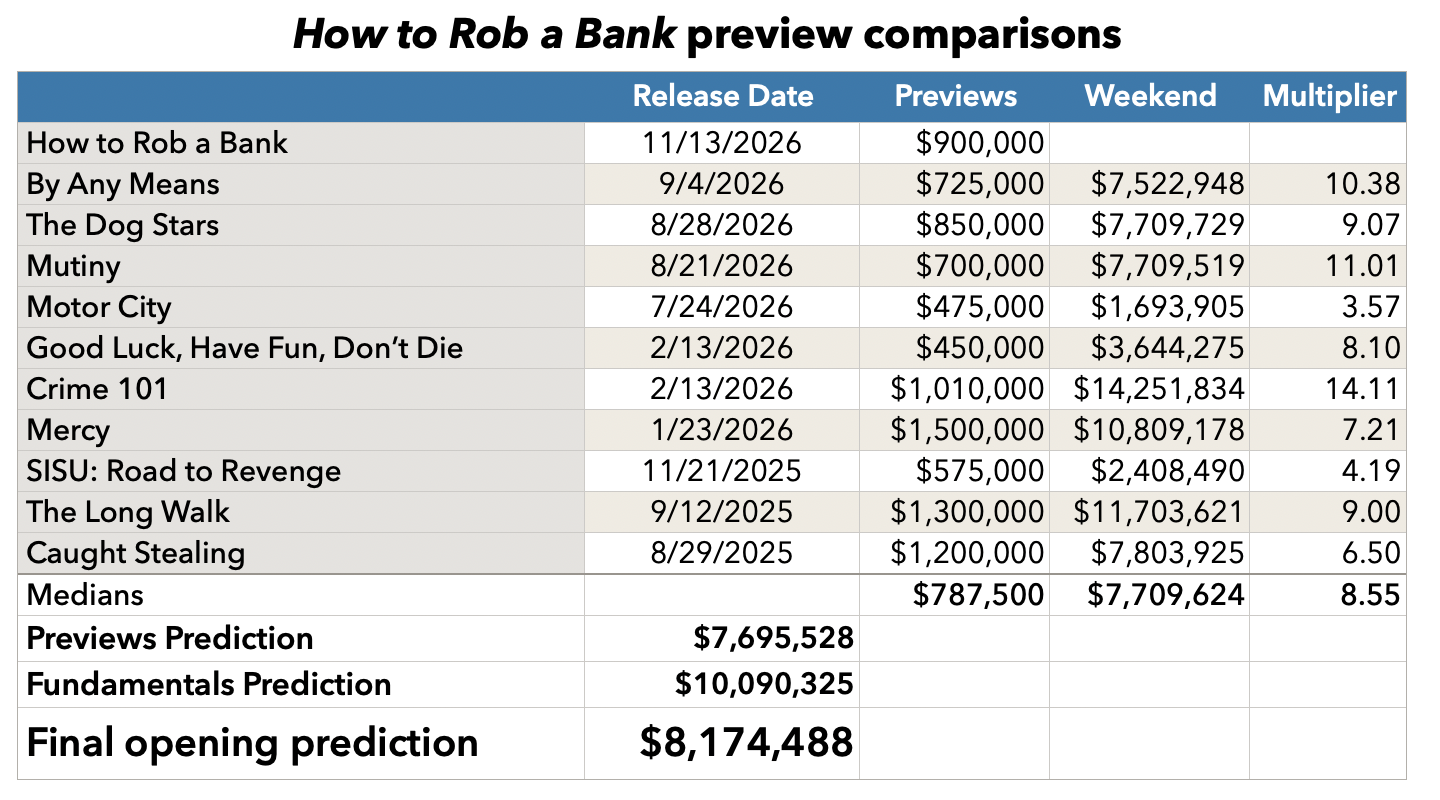
Thursday previews came in at $900,000. Recent action thrillers turned their previews into openings at a median of 8.55 times, from Crime 101, which turned $1.0 million into $14.3 million in February, to The Long Walk, at 9.00 times $1.3 million last year. That gives $7.7 million. Our prediction of $8.2 million sits between the two methods, closer to the previews, and should be good for fourth place.
Sony took an unusual route with Ghost Soldier, opening it on Wednesday, Veterans Day, in 2,558 theaters. William Eubank directs Jim Caviezel as a former soldier drawn out of retirement, from a script co-written by Randall Wallace, who wrote and directed We Were Soldiers. Olivia Thirlby, Garret Dillahunt and Shea Whigham co-star. No film this century has opened in more than 1,500 theaters on a Wednesday Veterans Day. The closest precedent is Caviezel’s own Sound of Freedom, which opened on Tuesday, July 4, 2023, and took $14.2 million on the day.
The holiday gave Ghost Soldier $2.3 million on Wednesday, but it fell 65% to $803,000 on Thursday. Much of that fall is the holiday itself. When Veterans Day landed on a Thursday, films that had opened the day before rose by 40% to 80%: Clifford the Big Red Dog in 2021 and The Polar Express in 2004. In an ordinary week, a Wednesday opener falls about 20% on Thursday. Madame Web, which Sony opened on Valentine’s Day 2024, also a Wednesday, fell 64% the next day. So Thursday is the better guide. Wednesday openers on an ordinary weekend take between 5.4 and 7.3 times their Thursday from Friday to Sunday, which points to about $5.2 million for the weekend, $8.3 million for five days, and sixth place.
That is about $2,000 per theater, which suggests the film’s audience turned out for the holiday and may not come back in the same numbers. There is an upside case. Sound of Freedom fell 72% the day after its July 4 opening, then rose every day through its first weekend, to $19.7 million. A strong Friday would be the first sign that Ghost Soldier is following the same path.
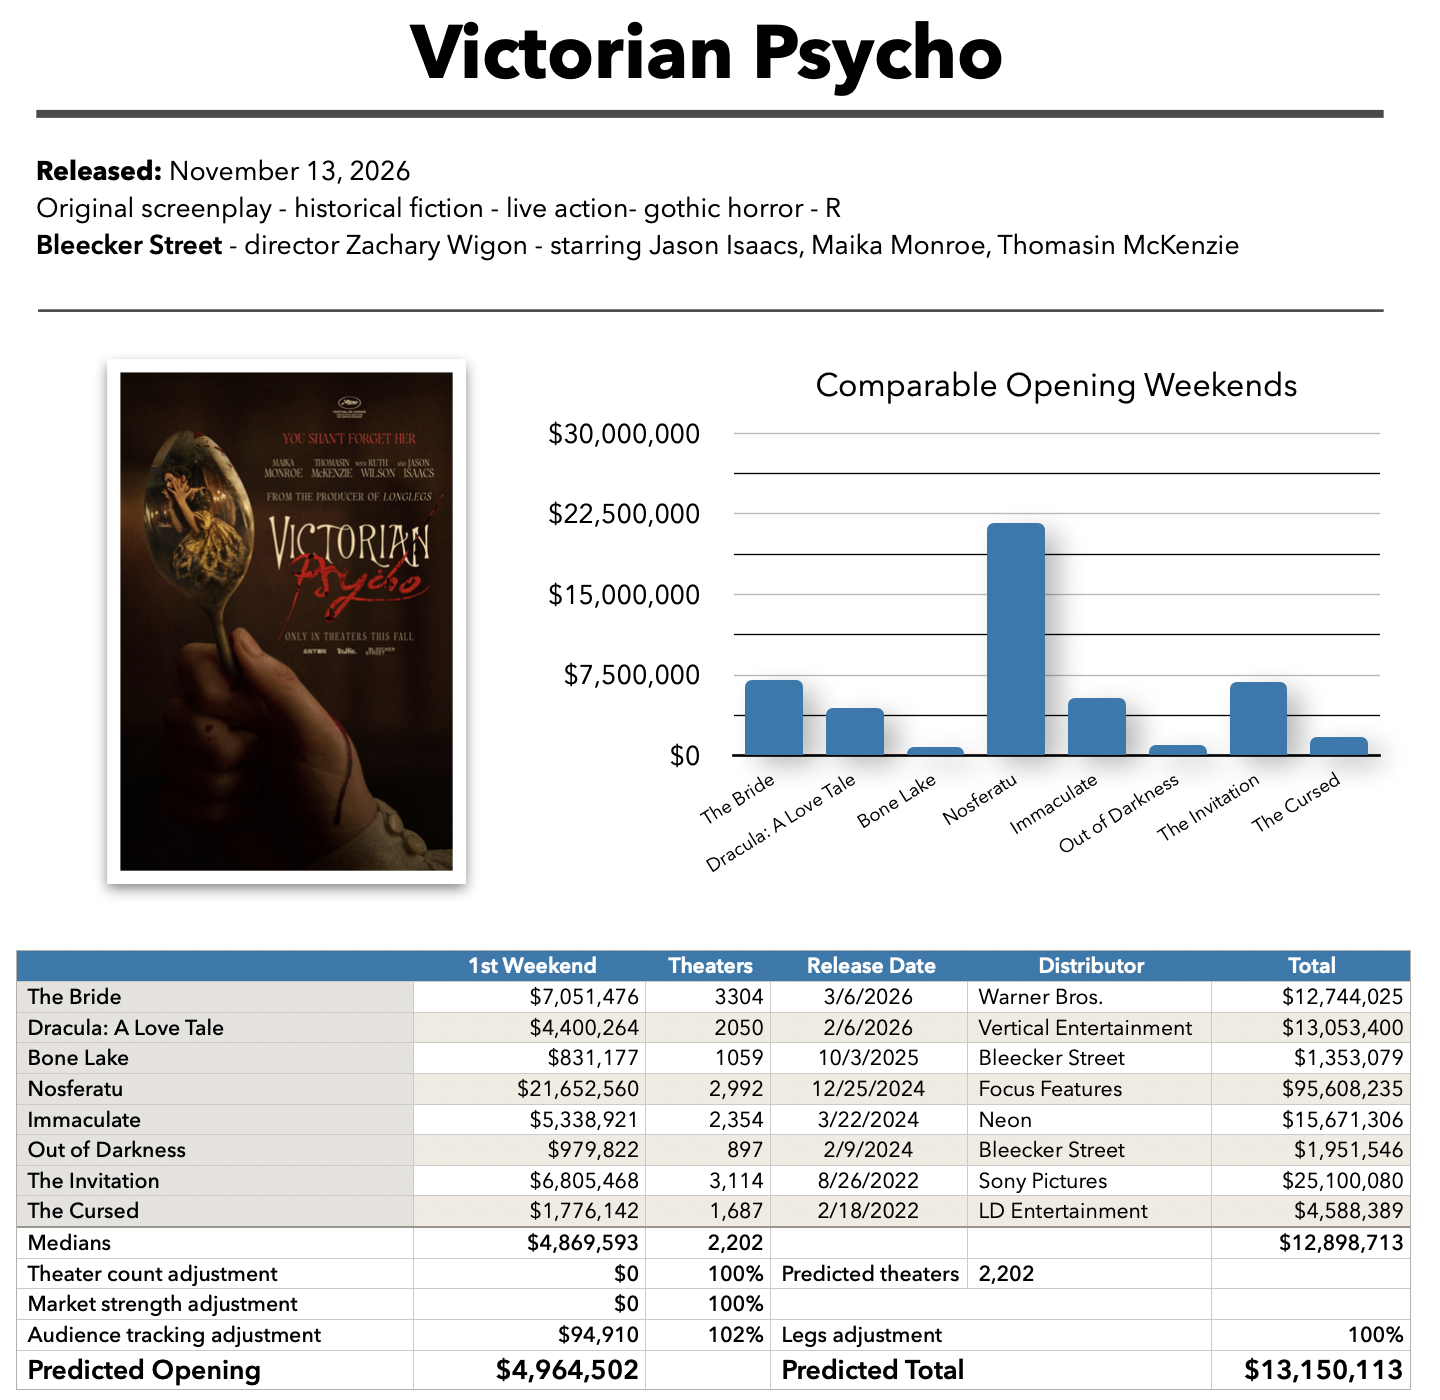
Bleecker Street opens Victorian Psycho in 1,206 theaters. Zachary Wigon directs the Gothic horror, set in the 1850s and written by Virginia Feito, with Maika Monroe, Thomasin McKenzie, Ruth Wilson and Jason Isaacs.
Recent period and Gothic horror gives a wide spread of openings. Nosferatu took $21.7 million over Christmas 2024, while The Bride opened with $7.1 million in March and Immaculate with $5.3 million in 2024. Bleecker Street’s own Bone Lake took $831,000 last year. The median is $4.9 million, and with tracking about in line, the baseline is $5.0 million. No previews were reported, so that is our prediction, close behind Ghost Soldier in seventh.
Here’s how the model thinks the full top ten will shape up:
Godzilla Minus Zero is expected to fall 60% to $12.2 million. That is a steep drop, but $6.7 million of its opening came from previews and early-access screenings. The Cat in the Hat should fall 57% to $8.67 million. Ramayana: Rise of a Legend should hold best of the group, down 29% to $6.37 million despite losing 323 theaters. You Can See Everything gives up 628 theaters and should fall 49% to $4.3 million. Laika’s Wildwood and Clayface are both expected to fall 45%, to $3.99 million and $3.72 million, to round out the top ten.
The chart leaves out one film that should make it. Searchlight expands Wild Horse Nine from 1,100 theaters to about 2,000 this weekend, an unusually large increase for a second weekend, and the model, which works from how films normally hold, places it just outside the top ten. It took $502,000 on Thursday from its original 1,100 theaters, and with almost twice as many screens it should take around $5 million, which would put it in the middle of the top ten and push Clayface out.
As usual, we’ll post numbers as soon as we receive them through the weekend, and, if you need a head start on the numbers for upcoming movies, The Numbers Business Report has predictions and tracking for all movies coming up in the next 12 months, and our weekly subscription option puts you first in line for our detailed weekend predictions on Friday morning.
Theater counts: Ebenezer and The Cat in the Hat will lead the field in theater counts this weekend
November 12, 2026
A nationwide Microsoft Outlook outage today has delayed most theater counts and daily box office reports, though a few estimates were announced by the studios last week, and we have a few actual numbers. Ebenezer is expected to open in roughly 3,500 locations, and How to Rob a Bank is also headed for a wide release, with about 2,700 theaters. Rounding out the group, Victorian Psycho is set to launch in 1,206 cinemas.
In other theater count news, Jim Caviezel’s Ghost Soldier hit theaters on Wednesday, picking up an estimated $2.3 million from 2,558 venues and will hold that count throughout the weekend. The Elizabeth Holmes documentary You Can See Everything sheds 628 locations this weekend, but is still widely available in 1,845 movie houses. The Arkansas-set drama, Mouse will open in 375 locations, while the thriller Paper Tiger, starring Adam Driver, Scarlett Johansson and Miles Teller will debut in six theaters this weekend before expanding wide next weekend.
The Numbers Business Report looks at audiences in the millions
November 9, 2026
This year’s domestic box office is on track to pass $10 billion, but the biggest movies aren’t the reason. The top 12 films in North America have earned around $4 billion combined every year since 2022, and the growth is coming from everything else. In this month’s Business Report, our feature article looks at the audiences driving that growth, the ones still waiting for movies made with them in mind, and how to bring them into theaters.
Independent distributors are the clearest winners so far. Films from independents (including studio specialty divisions like Focus and Searchlight) have earned $1.35 billion this year, 17.7% of the domestic total and the highest share in 11 years. Creator-driven hits like Obsession ($263.5m), Backrooms ($197.5m), and Iron Lung ($41.1m) weren’t powered by star power or a franchise. What they had was an audience. Subscribe to read the full feature.
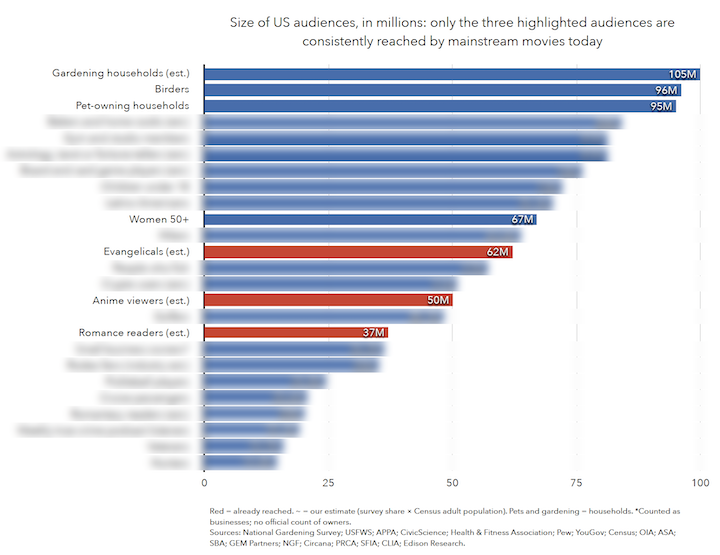
The chart below shows the size of some of the US audiences we examine, in millions of people. Subscribe to see the full list.
We start with three audiences the industry has already found: faith audiences, anime fans, and fans of YouTube creators. Each was treated as niche for years and is now mainstream. From there, we apply four tests to find the next ones, and a long list of audiences emerges that number in the millions but rarely see a film made for them. Among them are the 67 million women aged 50 and over in the US, whose audience has shown up for films like The Devil Wears Prada 2 ($220.6m), as well as young kids, romantasy readers, retirees, and fans of Taylor Sheridan’s Yellowstone universe.
So how much is an under-served audience worth? Tyler Perry’s 20 theatrical films earned $1.01 billion domestically between 2006 and 2019, an audience the theatrical business has since let walk away. Using what anime and faith audiences spent in 2025 as a guide, we estimate that women 50 and over alone could be worth $221 million to $283 million a year at the box office. We also look at how independent producers and distributors can reach these audiences directly, before a film is booked.
We’re introducing two new tools, available exclusively to Business Report subscribers. The new Numbers Report Builder turns a plain-English question, such as “the top R-rated horror movies of 2025 by worldwide box office,” into a report you can edit, save, share, and embed. Saved reports get a permanent link that anyone can view, and can be kept live with the latest figures or saved as a dated snapshot.
We’re also launching The Numbers API. Take almost any address on The Numbers, change “www” to “api,” and the same data comes back in JSON format, ready to use in your own analysis, software tools, or LLMs. Twelve endpoints are live now, covering movie details, cast and crew, franchises, daily, weekend and weekly charts, box office data, and saved Report Builder reports, with more on the way. For now, these tools are restricted to Business Report subscribers, who can activate them at the-numbers.com/pro-activate.
We have our final pre-release predictions for all of November’s wide releases, including The Hunger Games: Sunrise on the Reaping and Hexed (among many others), along with our full 2026 and Q1-Q3 2027 predictions.
Our domestic and international release schedules cover all films releasing domestically over the next month, and all major international releases in 15 territories, organized by date and by movie.
For the home market, we have a monthly update on the theatrical window for new releases, including trend analysis and a studio-by-studio comparison of average windows in 2025 and 2026. We’ve also added information on what films are available or coming soon to streaming services.
On the talent front, we include Bankability values for the top 500 creative talents in the business, expanding our unique perspective on the people in front of, and behind the camera.
To take our prediction analysis further, alongside The Business Report, we are publishing a six-week market theatrical forecast every week. That has day-by-day predictions for all movies in the top 10 and the expected market size over the next 42 days. Subscribers also receive print and digital editions of the Report, and optional forecast spreadsheets and Bankability reports. Contact The Numbers Business Report team to subscribe to the weekly edition. Click here to subscribe to The Numbers Business Report monthly edition.
The Numbers team is heading to Los Angeles for the American Film Market, which runs November 10–15 in Century City. It’s our first AFM as the official data partner of the Independent Film & Television Alliance (IFTA), the organizer of AFM, and we’re looking forward to meeting filmmakers, sales agents, distributors and financiers throughout the week.
As we announced in September, IFTA and The Numbers are collaborating on year-round original research and analysis of trends in the independent sector. IFTA members get preferred access to our Comp Analysis Reports and research services, educational webinars on financing, market positioning and distribution strategy, and data and research support for AFM programming throughout the year.
If you’re getting ready for the market, the replay of our “Know Before You Go: Preparing for AFM” webinar is available to watch now. Presented by The Numbers with AFM, it builds on the first “How to Work the AFM” webinar and takes a deeper look at the preparation that happens before you walk into the market: researching the marketplace, identifying the right partners, developing realistic budgets, evaluating comparable films, and preparing for productive conversations with buyers, sales agents and financiers. The panel featured producer Jack Binder; Bruce Nash, founder and president of Nash Information Services; Sara Elizabeth Timmins, producer and indie film consultant at Life Out Loud Films; and Ben Yennie, founder and principal of Disrupt Entertainment.
This year’s market comes at a good moment for independent film. As of late October, films released by independent distributors (including studio specialty divisions like Focus and Searchlight) had earned $1.35 billion in 2026, 17.7% of the domestic total and the highest share in 11 years. Our feature article in this month’s Business Report, “Audiences in the millions,” looks at the large, enthusiastic audiences behind that growth, and the ones still waiting for films made with them in mind.
If you’re bringing a project to AFM, our Research Services team can help you back your pitch with data. Our Comp Analysis is a custom comparable-films report built around a project you’re financing, distributing or pitching. It covers about 20 comparable films selected jointly with you, with their domestic and international theatrical performance, P&A spend, downstream revenue across TV, home video and ancillary windows, and investor-scenario modeling based on the comp set’s actual performance. It’s delivered as an Excel spreadsheet and a PDF report.
Production companies, financiers, sales agents, distributors and individual filmmakers commission a Comp Analysis when they need independent third-party analysis to support a financial conversation, whether they’re assembling a private placement memorandum, finalizing a slate decision or preparing for a market. The Numbers has been preparing custom film-finance research for more than 25 years, for clients ranging from major studios to first-time filmmakers.
If you’d like to connect about your film or meet with the team at AFM, email us at research@the-numbers.com. To get started on a Comp Analysis, include a one-paragraph description of your project, and we’ll get back to you to schedule a scoping call.
The Numbers Business Report: Q3 2027 Box Office Prediction
October 5, 2026
The last two Business Reports featured our first analysis of 2027, with predictions for all announced wide releases in the first and second quarters. In this month’s Report, we continue building out predictions for 2027, shifting our focus towards the second half of the year.
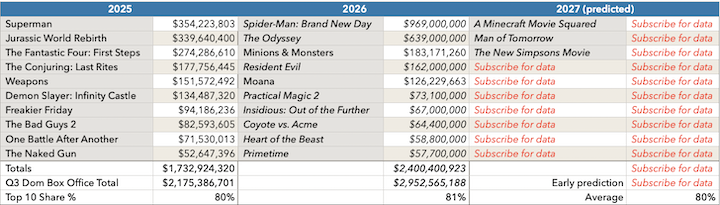
The table below highlights our model’s current prediction for the top 10 films of Q3 2027, shown alongside the top 10 grossers from the same period in 2026 and 2025. Subscribe to receive our full predictions.
July’s releases once again dominate Q3, led by a trio of franchise titles. Predicted to claim the top spot is A Minecraft Movie Squared, the sequel to A Minecraft Movie, which earned $424.1m domestically. Next is DC Studios’ Man of Tomorrow, the follow-up to Superman, which topped Q3 2025 with $354.2m. Rounding out the month is A Quiet Place Part III, the latest in a franchise that has earned $487.3m to date.
We’ll be updating our tracking as the months go on, and our full prediction for 2027 releases in November. Subscribe to The Numbers Business Report to receive monthly updates.
Also in this edition...
We have our final pre-release predictions for all of October’s wide releases, including Street Fighter and Clayface (among many others), along with our full 2026, Q1-Q3 2027 predictions.
Our domestic and international release schedules cover all films releasing domestically over the next month, and all major international releases in 15 territories, organized by date and by movie.
For the home market, we have a monthly update on the theatrical window for new releases, including trend analysis. We’ve also added information on what films are available or coming soon to streaming services.
On the talent front, we include Bankability values for the top 500 creative talents in the business, expanding our unique perspective on the people in front of, and behind the camera.
To take our prediction analysis further, alongside The Business Report, we are publishing a six-week market theatrical forecast every week. That has day-by-day predictions for all movies in the top 10 and the expected market size over the next 42 days. Subscribers also receive print and digital editions of the Report, and optional forecast spreadsheets and Bankability reports. Contact The Numbers Business Report team to subscribe to the weekly edition. Click here to subscribe to The Numbers Business Report monthly edition.
Ticket prices up 5% in Q2 vs. 2025 as attendance climbs 10%
September 10, 2026
The first half of 2026 has brought a lot of optimism about the future of the theatrical industry, with the second quarter delivering phenomenal results. For some theater chains, total revenue during the second quarter reached historical records. Fueled by the success of movies such as The Super Mario Galaxy Movie, Michael, Toy Story 5, Obsession, The Devil Wears Prada 2, and Backrooms, admissions revenue increased by around 13% on average among the theater chains tracked in this analysis compared with the same period last year. This growth was primarily driven by a 10% average increase in attendance compared with Q2 2025.
Based on these results, our model estimates an average ticket price of $12.27 for the second quarter, approximately 5% higher than in 2025. The relatively modest increase in average ticket price compared with the growth in admissions revenue suggests that the majority of the revenue growth was driven by increased attendance rather than pricing strategies alone.
Additionally, the average concession spend (among the three theater chains reporting concession revenue) was approximately $8 per patron during the quarter, 3% higher than in Q2 2025.
Our model relies on average ticket price data reported in SEC filings from three major theater chains: AMC, Cinemark, and Cineplex. This data is modeled against historical averages previously reported by the Cinema United organization (through 2021) and The Cinema Foundation’s 2022 Theatrical Market Report. Beginning in 2025, we updated our model using additional data from our partners, resulting in revised estimates starting from 2022, as shown in the table below.
The Numbers Named Official Data Partner of the Independent Film & Television Alliance
September 2, 2026
We’re excited to announce our new strategic partnership with the Independent Film & Television Alliance (IFTA), organizer of the American Film Market (AFM), naming The Numbers as the organization’s official data partner.
The collaboration will give IFTA members preferred access to our Comp Analysis Reports and research services, along with educational webinars on financing, market positioning, and distribution strategy, plus data and research support for AFM programming throughout the year.
Bruce Nash, founder of The Numbers and president of Nash Information Services, said the partnership would help IFTA members “make more informed decisions in a complex and growing marketplace”.
IFTA president and CEO Jackie Brenneman said, “Our collaboration with The Numbers will give our members and the broader independent community greater insight into what is happening across the marketplace, help them put that information to work as they finance, produce, sell and distribute content around the world, and better understand the trends shaping where the business is headed.”
The Numbers Business Report: Q2 2027 Box Office Prediction
August 31, 2026
Last month, we started our analysis of 2027 with predictions for all announced wide releases in the first quarter. In this month’s Business Report, we continue building out our early predictions for 2027, shifting our attention to the second quarter of next year. Our feature article provides our first prediction for the second quarter, with detailed movie-by-movie forecasts for the major releases coming out.
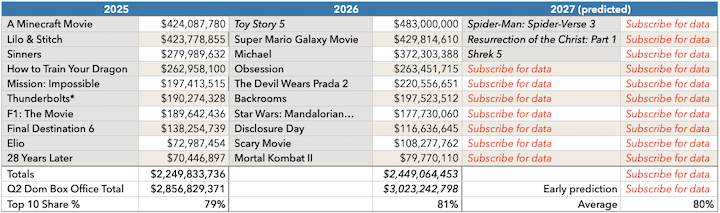
The table below highlights our model’s current prediction for the top 10 films of Q2 2027, shown alongside the top 10 grossers from the same period in 2026 and 2025. Subscribe to receive our full predictions.
Turning to movies released in Q2 2027, by month, our current standouts are:
April:The Legend of Zelda ($280m)
May:The Resurrection of Christ: Part One ($310m)
June:Spider-Man: Beyond the Spiderverse ($330m) and Shrek 5 ($300m)
Similar to previous years, Q2 2027 should feature several titles earning over $100 million, primarily from established and successful franchises. Examples include Spider-Man: Beyond the Spider-Verse, part of Sony’s animated Spider-Verse franchise ($571.8 million domestic across its first two films), and Shrek 5, continuing a series that has grossed $1.61 billion domestically since 2001. Other major releases include Star Wars: Starfighter, extending a franchise that has grossed $5.31 billion domestically since 1977; The Resurrection of the Christ: Part One, following 2004’s $370.8 million domestic hit The Passion of the Christ; and The Legend of Zelda, the video game franchise’s first theatrical adaptation.
We’ll be updating our tracking as the months go on, and our full prediction for 2027 releases in November. Subscribe to The Numbers Business Report to receive monthly updates.
Also in this edition...
We have our final pre-release predictions for all of September’s wide releases, including Practical Magic 2 and The End of Oak Street (among many others), along with our full 2026 and Q1 2027, and Q2 2027 predictions.
Our domestic and international release schedules cover all films releasing domestically over the next month, and all major international releases in 15 territories, organized by date and by movie.
For the home market, we have a monthly update on the theatrical window for new releases, including trend analysis. We’ve also added information on what films are available or coming soon to streaming services.
On the talent front, we include Bankability values for the top 500 creative talents in the business, expanding our unique perspective on the people in front of, and behind the camera.
To take our prediction analysis further, alongside The Business Report, we are publishing a six-week market theatrical forecast every week. That has day-by-day predictions for all movies in the top 10 and the expected market size over the next 42 days. Subscribers also receive print and digital editions of the Report, and optional forecast spreadsheets and Bankability reports. Contact The Numbers Business Report team to subscribe to the weekly edition. Click here to subscribe to The Numbers Business Report monthly edition.
The Numbers Business Report: Q1 2027 Box Office Prediction
August 13, 2026
With the first half of 2026 officially wrapped, we turn our thoughts to 2027 in this month’s Business Report. Our feature article provides our first prediction for the first quarter, with detailed movie-by-movie forecasts for the major releases coming out.
Major franchise continuations and sequels dominate the first quarter this year, much more than last, although the late 2026 film, Avengers: Doomsday, is predicted to earn $660m in total, and $217.8m of that falls into 2027. March’s top earner, Sonic the Hedgehog 4, follows closely behind with a $210m predicted gross. We also see the latest(/final?) installments of major franchises like Dune and Jumanji from December of this year contribute to the top earners of Q1 2027.
Turning to movies released in Q1 2027, by month, our current standouts are:
January:The Beekeeper 2 ($59m)
February:Ice Age: Boiling Point ($142m)
March:Sonic the Hedgehog 4 ($210m)
We’ll be updating our tracking as the months go on, and our full prediction for 2027 releases in November. To discover our full official prediction for the first quarter, subscribe to The Numbers Business Report.
Also in this edition...
We have our final pre-release predictions for all of August’s wide releases, including The End of Oak Street and The Dog Stars (among many others), along with our full 2026 and Q1 2027 predictions.
Our domestic and international release schedules cover all films being released domestically over the next month, and all major international releases in 15 territories, organized by date and by movie.
For the home market, we have a monthly update on the theatrical window for new releases, including trend analysis. We’ve also added information on what films are available or coming soon to streaming services.
On the talent front, we include Bankability values for the top 500 creative talents in the business, expanding our unique perspective on the people in front of, and behind, the camera.
To take our prediction analysis further, alongside The Business Report, we are publishing a six-week market theatrical forecast every week. That has day-by-day predictions for all movies in the top 10 and the expected market size over the next 42 days. Subscribers also receive print and digital editions of the Report, and optional forecast spreadsheets and Bankability reports. Contact The Numbers Business Report team to subscribe to the weekly edition. Click here to subscribe to The Numbers Business Report monthly edition.
Movie pages now have full international details, plus cast & crew
July 22, 2026
Our site build-out continues this week with two major new features on the movie pages. The International tab (which sharp-eyed readers will have noticed appear a few days ago) shows the details of all international territories for which we have reported box office for each movie. This includes our complete archive of movies, with extensive historical information.
Also new this week is the cast and crew details for movies. Again, we have extensive historical information, along with details for recent releases. The cast & crew tab highlights above-the-line and leading credits in each movie.
Look for more new features soon as we build out the site, and if you’re interested in background information on what’s been happening at The Numbers over the past few months, check out Stephen Follows’ article, published today.
The Numbers Business Report: Live AI search tracking, a mid-year update
July 9, 2026
We introduced our Live AI Search tracking in the March issue of The Numbers Business Report, and have been working on refining our collection and analysis of the numbers since then. This month, we show some early results in using these new statistics to predict opening weekend box office for upcoming movies.
Large language models such as ChatGPT, Claude, and Perplexity generally consist of two components: a crawler and a live search agent. Starting last year, we began tracking and gathering all requests coming from AI agents. We can then link these data points to our OpusData database, allowing us to monitor what AI agents are requesting and translate that into a signal of audience interest.
The charts below show the first results of our modeling. They show the correlation between ChatGPT live searches in the 28 days leading up to the release of a movie and the movie’s opening weekend.
We have our final pre-release predictions for all of July’s wide releases, including The Odyssey and Spider-Man: Brand New Day (among many others), along with our full 2026 predictions.
Our domestic and international release schedules cover all films being released domestically over the next month, and all major international releases in 15 territories, organized by date and by movie.
For the home market, we have a monthly update on the theatrical window for new releases, including trend analysis. We’ve also added information on what films are available or coming soon to streaming services.
On the talent front, we include Bankability values for the top 250 creative talents in the business, expanding our unique perspective on the people in front of, and behind the camera.
To take our prediction analysis further, alongside The Business Report, we are publishing a six-week market theatrical forecast every week. That has day-by-day predictions for all movies in the top 10 and the expected market size over the next 42 days. Subscribers also receive print and digital editions of the Report, and optional forecast spreadsheets and Bankability reports. Contact The Numbers Business Report team to subscribe to the weekly edition. Click here to subscribe to The Numbers Business Report monthly edition.
Here are the official studio numbers for the weekend (click the image for a full chart of all films reporting).
Toy Story 5 opened to exceptionally strong audience reception, with Rotten Tomatoes reporting a 95% “Verified Hot” audience score from more than 2,500 verified moviegoers, alongside a 93% Certified Fresh critics’ rating. Early audience polling from ComScore’s PostTrak showed top-tier satisfaction, including 5 out of 5 stars from parents and 4.5 out of 5 stars from both general audiences and children. Overall, 91% of viewers rated the film positively, with 63% describing it as “excellent.” CinemaScore reinforced the film’s strong debut, awarding it an “A,” continuing Pixar’s consistent streak of A-range grades across its releases.
Premium viewing formats played a significant role in the film’s opening weekend performance, accounting for 40% of total box office revenue. Standard 2D screenings made up the majority at 60%, while premium large format (PLF) 2D contributed 19% and IMAX 2D added 8%. In total, 2D formats represented 89% of ticket sales, compared to 11% for 3D formats. Audience demographics reflected broad appeal, with a gender split of 57% female and 43% male. The film attracted a diverse audience, including 37% Caucasian, 32% Hispanic, 13% African American, 9% Asian, and 9% Native American or other groups. Age distribution skewed toward families and younger adults, led by viewers under 12 (25%), followed by ages 25–34 (22%) and 35–44 (20%).
Internationally, Toy Story 5 delivered strong opening results across key markets, led by Mexico with $26.6 million, followed by the United Kingdom at $20.0 million and China at $18.0 million. In Europe, France contributed $7.2 million, Spain $5.5 million, and Italy $3.5 million, while Australia added $6.9 million. Latin America proved particularly robust, with Brazil and Korea each generating $6.1 million, Argentina $5.4 million, Colombia $4.2 million, and Central America $3.7 million, underscoring the film’s broad global appeal.
The Numbers Business Report asks, where have all the indie films gone?
June 11, 2026
Movies from the major studios may get most of the buzz, but by the raw numbers, most movies that get made and distributed have more humble origins. In the latest The Numbers Business Report, we look at the universe of movies produced and distributed for sale, either in theaters, on a digital transactional platform, or a subscription streaming service in the domestic market (the United States and Canada) between 2021 and 2025. In this study, we call these “commercial releases,” in contrast to “ad-supported content,” which includes content produced for platforms like YouTube, and also movies released solely on AVOD services.
What we’ve found is a tale of two markets. On the one hand, the theatrical market has shown growth over the past five years, with 101 domestically-produced and released narrative features earning over $1 million at the box office in 2021, and 160 such movies in 2025. With new distribution technologies making it easier than ever to get movies into theaters, the total number of domestically-produced narrative features getting any sort of theatrical release has also increased, from 494 in 2021 to 598 in 2025.
The increase in that number contrasts with a steep decline among direct-to-digital titles. Movies bypassing theaters, but still having a commercial release, fell from 1,427 in 2022 to 721 last year. That’s a decline of nearly 50% in just three years.
Subscribe to The Business Report for details on how we compiled the data, and what we think is happening to cause this remarkable shift in the independent film business in such a short time.
Also in this edition...
We have our final pre-release predictions for all of June’s wide releases, including Disclosure Day and Toy Story 5 (among many others), along with our full 2026 predictions.
Our domestic and international release schedules cover all films being released domestically over the next month, and all major international releases in 15 territories, organized by date and by movie.
For the home market, we have a monthly update on the theatrical window for new releases, including trend analysis. We’ve also added information on what films are available or coming soon to streaming services.
On the talent front, we include Bankability values for the top 250 creative talents in the business, expanding our unique perspective on the people in front of, and behind the camera.
To take our prediction analysis further, alongside The Business Report, we are publishing a six-week market theatrical forecast every week. That has day-by-day predictions for all movies in the top 10 and the expected market size over the next 42 days. Subscribers also receive print and digital editions of the Report, and optional forecast spreadsheets and Bankability reports. Click here to subscribe.
We’re excited to announce a major update to The Numbers. We’re rebuilding the site to take advantage of new technologies and introduce a suite of new features. Look for many more updates in the days and weeks to come, but we wanted to get the site up and running on our new servers as quickly as possible so you can still get our first-in-the-industry box office reporting while we work.
We imagine you have some questions…
Where have you been?
This is a major upgrade to all our systems, from our back-end OpusData database, through The Numbers server infrastructure to the web-site front end. As is common with a major project like this, we’ve hit some issues along the way that have slowed progress. We’re working round the clock to get everything up and running… watch this space!
Where are the historical charts, movie pages, franchise information, records pages…?
We’ll be bringing back pages from the old version of the site ASAP, prioritizing the most popular pages first.
Are you going to put everything behind a paywall?
No! The Numbers has always been completely free to use, and we intend to keep it that way.
Can’t you just bring back the old site?
Unfortunately, the old site is incompatible with our new infrastructure. After careful consideration, we decided to focus our resources on improving the new site, rather than dividing our time between making the old site compatible with the new infrastructure and building the new site. That will pay off in the end, and we apologize that things will be ”under construction“ for a while.
We’ll post regular updates on progress here on the home page, and on social media. Feel free to message us there if you have questions, or email us at support@the-numbers.com.
We look forward to sharing new features with you soon!