September 30th, 2014
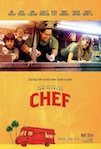
Transformers: Age of Extinction leads the pack of new releases this week, at least in terms of sales potential. It is by far not the best movie on this week's list, but it does appear to have to scared away a lot of the competition. Fortunately, the next best selling new release is Chef on Blu-ray Combo Pack, which is a clear contender for Pick of the Week. The main competitor for this title is Once Upon a Time in America on Blu-ray, but I'm going with Chef.
More...
September 30th, 2014
Jon Favreau's career behind the camera started out with smaller movies. He co-wrote Swingers and wrote and directed Made. However, recently he has directed a number of major movies. He was the one behind the camera for the first two Iron Man movies, for instance, and the average budget for his three most recent films he directed is close to $175 million. With his latest film, Chef, he went the opposite direction and created a much, much smaller film. Was he able to still maintain his usual high level of quality? Or does he need the spectacle to make a compelling movie?
More...
September 3rd, 2014
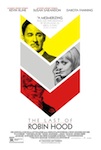
The Last of Robin Hood led the way on the Per Theater Chart with an average of $17,709 in two theaters. Through a Lens Darkly was the only other member of the $10,000 club with $11,764 in its lone theater. This is more impressive, because it opened on Wednesday.
More...
July 23rd, 2014
The biggest film on the per theater chart this weekend was Boyhood, for the second weekend in a row. It expanded from 5 to 34 theaters, but its average fell just 56% to $34,418. That's fantastic. It has already earned a measure of mainstream success, while it has its eyes on Chef for best limited release for the summer. Second place went to There's No Place Like Utopia with $30,710 in one theater. This is a great start, but there are still no reviews, so I think it will have short legs. A Five Star Life and Mood Indigo were relatively close with averages of $15,996 and $13,256 respectively. The only wide release to reach the $10,000 club was The Purge: Anarchy, which earned an average of $10,626.
More...
June 29th, 2014
Transformers: Age of Extinction is set to deliver the year’s biggest weekend, as it performs to sell-out crowds across the country. Paramount is projecting a weekend total of $100 million as of Sunday morning, which honestly seems like a conveniently round number. Perhaps the studio is playing it safe, and the actual weekend number will be a few million over $100 million? Or maybe they’re hoping that announcing a $100 million weekend will help encourage people to theaters today and push the film over the line? Based on the numbers we’re seeing, it looks more like the latter, and we’ll have to wait until Monday to see if Age of Extinction will actually be the first $100 million opener of the year. At the end of the day, it probably doesn’t matter a huge amount: $99 million versus $101 million is a rounding error, and the film has topped $200 million internationally this weekend, which is a great start towards repaying its reported $210 million production budget.
More...
June 24th, 2014
There were three films in the $10,000 club. They were led by the number one film on the overall chart, Think Like a Man Too, with an average of $13,142 in more than 2,000 theaters. Venus in Fur was close behind with an average of $12,381 in two theaters. The final film in this list was Le Chef with $11,290 in one theater.
More...
June 11th, 2014
Obvious Child led the way on the per theater chart with $77,000 in three theaters for an average of $25,772. The Fault in Our Stars earned an average of $15,128, which was surprisingly strong. The final film in the $10,000 club was Citizen Koch, which earned $10,200 in one theater.
More...
June 3rd, 2014
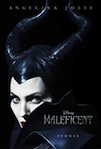
The overall box office leader, Maleficent, also led the way on the per theater chart with an average of $17,586 in nearly 4,000 theaters. Korengal was the best of the limited releases earning $14,630 in one lone theater. Night Moves was close behind with an average of $12,050 in two theaters. The final $10,000 film was Elena with $10,341 in one theater.
More...
May 28th, 2014
There were only two films in the $10,000 club this weekend. X-Men: Days of Future Past led the way with an average of $22,729 in nearly 4,000 theaters. The only other film was The Dance of Reality with an average of $12,384 in two theaters. However, if one were to include holiday Monday, Words and Pictures would also reach the $10,000 club with an average of $11,544 in ten theaters.
More...
May 27th, 2014
X-Men: Days of Future Past easily won the weekend race at the box office earning more than $100 million over the four-day weekend. That's great news and it helped the overall box office grow by 5% to $187 million over the three-day weekend from last week. That's the good news. The bad news the other new release, Blended, bombed and the three-day weekend was down 27% from the same weekend last year. In fact, this year's four-day weekend total of $231 million was 9% lower than last year's three-day total and 26% lower than the four-day weekend from last year. That's a devastating collapse. The only saving grace is last year was a record-breaking Memorial Day long weekend, so a sharp drop-off isn't that unexpected. So far, 2014 has pulled in $3.95 billion, which is 4% more than 2013's running tally of $3.80 billion.
More...
May 18th, 2014
After a huge start on Friday, estimated at $38.5 million, Godzilla looked as though it might be the first film of 2014 to have a $100 million opening weekend. But the monster movie seems to have run out of energy a little through the weekend, and Warner Bros. is projecting a weekend around $93.2 million, based on figures through Sunday morning. The film’s performance is well ahead of earlier tracking, which pegged its opening around $60 million–$80 million, and impressive for a non-sequel (although clearly Godzilla is a well-established franchise at this point). In fact, it is one of the top 10 non-sequel openers ever (see full list here).
More...
May 14th, 2014
It was a good week on the per theater chart with five films in the $10,000 club, led by Chef with an average of $34,160 in six theaters, which is the third best opening average of the year so far. Palo Alto was well back, but was still strong earning an average of $15,865 in four theaters. The overall box office leader, Neighbors, was next with an average of $14,954. There were also a couple of holdovers in the $10,000 club, which is impressive. Ida held on strong earning an average of $12,223 in seven theaters, with room to keep growing. Belle expanded from 4 theaters to 45 theaters, but still managed an average of $10,825. By this time next week, it will have reached its first major milestone, with more to come.
More...
May 11th, 2014
Comedy triumphs at the box office this weekend, with Neighbors posting an impressive $51 million, according to Universal’s Sunday morning estimate. That’s the 16th-biggest opening ever for a comedy film (depending somewhat on one’s definition of what constitutes a comedy), and comparable to the debut of Ted (which made $54 million in 2012). It’s also easily Seth Rogen’s best weekend, ahead of the $33.5 million debut for The Green Hornet, and Zac Efron’s best, beating High School Musical: Senior Year.
More...
May 9th, 2014
There are a number of limited releases coming out this week that are earning strong buzz and good reviews. Some of the films that have reviews that are strong enough to suggest box office success are Palo Alto and The Double, as well as two documentaries, Fed Up and Llyn Foulkes One Man Band. However, the film with the best combination of buzz and reviews is Chef.
More...
May 1st, 2014

It has been a great year so far and April was again a strong month. The box office was led by Captain America: The Winter Soldier, as it became the second film of the year to reach $200 million, while Rio 2 is on pace to become the seventh $100 million hit of the year. Big picture, 2014 has already hit $3 billion, which isn't a record for this time of the year, but it is $250 million ahead of 2013. That streak ends in May. Don't get me wrong. There are six films opening this month that at least have a shot at $100 million and two of those should earn more than $200 million and there are two others that at least have a shot at that milestone. Leading the way is The Amazing Spider-Man 2, which is looking to top The Winter Soldier and become the second biggest hit of the year so far. Its main competition this month is X-men: Days of Future Past, while Godzilla also has a shot at $200 million. Unfortunately, this month last year, Iron Man 3 earned more than $400 million, while two other films took in $200 million and seven films in total reached the century mark. That is going to be really hard to replicate this year and 2014 will likely lose some of its lead over 2013. Fortunately, 2014 has such a big lead that unless the box office really slumps, it will end the month with at least a small lead over 2013.
More...


-Thumbnail.jpg)
-Thumbnail.jpg)