October 10th, 2017

It’s a good week for the home market with top notch releases in nearly every category. Baby Driver is the biggest first run release of the week and one of the best releases. The Lure is a foreign-language film and one of two Criterion Collection releases in competition for Pick of the Week. Maudie is a Canadian limited release that did surprisingly well in theaters. Finally there’s Othello, which first came out more than 60 years ago. The only thing we are missing is a TV on DVD title. As for the winner, I’m giving Pick of the Week to, Othello, while Maudie wins Puck of the Week for Best Canadian Release.
More...
September 27th, 2017

Transformers: The Last Knight is the biggest release of the week and it has scared away a lot of the competition, but it’s garbage and should be avoided. There are no big releases that are pick of the week contenders, but some smaller ones fit the bill, including David Lynch: The Art Life: The Criterion Collection, HYOUKA: Part Two, and Shameless: The Complete Seventh Season. All are amazing and worth checking out, but none have many extras, so it is up to the role of the dice to determine the Pick of the Week. ... And it’s HYOUKA.
More...
August 13th, 2017

After a series of lackluster weekends at the box office, Annabelle: Creation is doing its bit to clear away the end-of-Summertime blues with a $35 million opening this weekend. That’s right in line with the $37 million Annabelle opened with three years ago, which is an impressive performance for a horror franchise. It’s also the best opening for a horror movie since Split’s $40 million start back in January. The first film in the franchise fell away quite rapidly, and ended up with $84 million in total, so a final total of over $100 million is far from assured, but with a production budget of only $15 million, and probably not much more than $20 million in marketing, this should be a highly profitable movie for Warner Bros., especially since the franchise is popular globally.
More...
July 11th, 2017
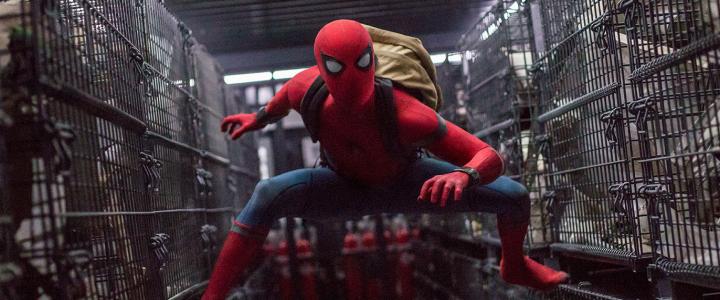
The weekend box office chart held few surprises. Every film in the top five was close to our predictions, while the top two films were a little stronger. This includes Spider-Man: Homecoming, which pulled in $117.03 million during its opening weekend, making it the second fastest debut of the summer. (Only Guardians of the Galaxy Vol 2 is ahead of it in that regard.) Despicable Me 3 held on better than most films this summer and will become a monster hit thanks to its international numbers. Overall, the box office rose by 22% from last weekend hitting $206 million. Unfortunately, this is still 5.1% lower than the same weekend last year. Before the summer began, 2017 had a $200 million lead over 2006. That lead is now down to just $13 million at $5.95 billion to $5.94 billion. This lead could be completely gone by the weekend.
More...
July 5th, 2017

The weekend box office chart was as predicted, at least in terms of the order. Most of the new releases / top five had weaker openings / sharper declines. Despicable Me 3 still led the way, but with a more subdued $72.43 million. Baby Driver is hoping to earn that much in total after a $20.55 million / $29.58 million opening. This is almost as much as it cost to make. The House, on the other hand, was DOA with just $8.72 million. On the positive side, Monday and Tuesday were much stronger than usual, so rather than looking at the weekend box office and saying it is weaker than anticipated, we could instead say the weekend box office was stretched out over five days. Overall, the box office grew 20% from last week to $169 million. This is down 11% from the same weekend last year, but again, one could argue this is due to a misalignment in the Independence Day holiday. Year-to-date, 2017 is still ahead of 2016, but the lead shrank to under $30 million at $5.64 billion to $5.61 billion.
More...
July 3rd, 2017

The combination of Canada Day and Independence Day has resulted in some studios not releasing the weekend final numbers today. Some are releasing final numbers, some have updated Sunday’s estimates, while others are just waiting until Wednesday for final results. Despicable Me 3 is in the middle category, as Universal revised its estimate downwards to $72.41 million. This is still a great opening, but it is also a troubling trajectory, as it has fallen a lot from Friday’s Estimates, when it looked like it was going to hit $83 million. Granted, this is still the sixth-biggest opening of the year, so Universal has reason to celebrate, but its internal multiplier suggests short legs for a family film. I think this is a case of franchise fatigue, as its reviews were good, even if they were not as good as the previous Despicable Me films.
More...
July 2nd, 2017

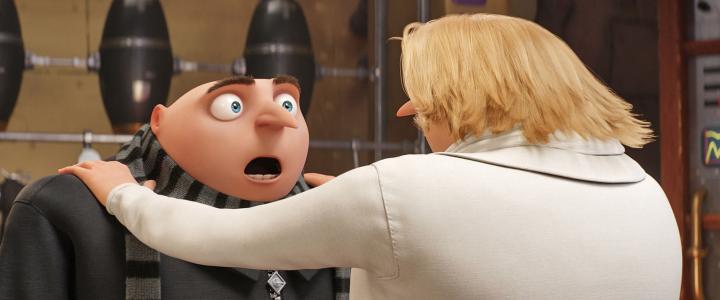
With July 4 falling on a Tuesday this year, this is less a holiday weekend, and more the beginning of a holiday week, and it’s bookended by new releases from two of the industry’s most reliable franchises. Despicable Me 3 starts off festivities this weekend with a solid-but-unspectacular $75.4 million from a record-setting 4,529 theaters. Breaking The Twilight Saga: Eclipse’s record for widest opening weekend of all time is no small feat for Universal, but it’s an ominous sign for the franchise that the only film to open in close to this number of theaters and pull in similar numbers at the box office was Shrek Forever After, which opened with $70.8 million in 4,359 theaters back in 2010. That was the last Shrek movie, and this might be a good time for Gru to call it a day.
More...
July 1st, 2017
As expected, Despicable Me 3 earned first place at the box office on Friday with $29.2 million. This is the best single day for an animated film this year. To emphasize, this isn’t just the best opening day, but the best single day, and it should top that on Saturday. The previous record was $23.00 million, earned by The Lego Batman Movie. This film’s reviews are not as good as The Lego Batman Movie’s reviews are (they both earned A minuses from CinemaScore) so it won’t have the same legs. That said, an $83 million opening is still a great start and roughly on par with Despicable Me 2.
More...
June 30th, 2017

Despicable Me 3 earned $4.1 million during previews last night, which is both good and bad. It is the best previews for an animated film this year, topping the $2.8 million Cars 3 earned earlier this month. However, it is weaker than the $4.7 million Despicable Me 2 earned and that film was a Wednesday release, so that would have depressed its previews even more, which makes this comparison even worse for Despicable Me 3. The Secret Life of Pets opened on a Friday and earned $5.3 million during its previews. If we use that film as a gauge, then Despicable Me 3 will earn $81 million over the weekend. Despicable Me 3 has earned weaker reviews than those The Secret Life of Pets earned, while it is also a sequel, which tends to hurt legs. We predicted $82 million, but that might be a little optimistic now. It should come close, on the other hand.
More...
June 29th, 2017
Despicable Me 3 should dominate the box office this weekend, which is good news, because the last few weeks have been underwhelming. In fact, we haven’t had a monster hit since Wonder Woman started the month off with a bang. The House is an R-rated comedy, but since the last such film to come out bombed, I’m a little worried about its chances. Baby Driver opened on Wednesday and its early numbers are promising. It won’t be a $100 million hit, but it should earn a solid profit for Sony. This weekend last year, there were no monster hits at the box office, but there was solid depth. This weekend, we should be much stronger on top, while the depth won’t be that much weaker, leading to 2017 ending its mini-losing streak.
More...
June 23rd, 2017

Despicable Me 3 is going to win next weekend’s box office race. There’s no doubt about that. In fact, it will make more than Baby Driver and The House will make combined. Because of this, it is the only real choice for the target film in this week’s box office prediction contest. In order to win, one must simply predict the opening three-day weekend box office number for Despicable Me 3.
Whoever comes the closest to predicting the film's opening 3-day weekend box office (Friday to Sunday), without going over, will win a Frankenprise consisting of their choice of either one TV on DVD release, two movies, or a kids package (could be a theatrical release, a couple of single-disc TV on DVD releases, or a full season TV on DVD release).
Whoever comes the closest to predicting the film's opening 3-day weekend box office (Friday to Sunday), without going under, will also win a Frankenprize, as described above.
Finally, we will be choosing an entrant from the group of people who haven't won, or haven't won recently, and they will win the final Frankenprize, as described above.
Entries must be received by 10 a.m., Pacific Time on Friday to be eligible, so don't delay!
More...
June 1st, 2017
May was a really soft month with only one unqualified hit, Guardians of the Galaxy, Vol. 2, which is climbing towards $375 million domestically. The second biggest hit of the month will be Pirates of the Caribbean: Dead Men Tell No Tales and I would be surprised if it tops $150 million by any serious margin. June looks a lot more profitable. There are five weeks and every week there is at least one film with a great shot at $100 million or more. In fact, there are four films with at least a decent shot at $200 million and we could double the number of $300 million hits released so far this year. Wonder Woman is widely expected to start the month with an explosive debut and pulling in more than $100 million during its opening weekend is more and more likely. That said, Despicable Me 3 will probably end up being the biggest hit overall with over $300 million. Meanwhile, Cars 3 and Transformers: The Last Knight are both aiming for $200 million. Last June was not particularly strong, outside of one hit. Finding Dory earned nearly $500 million domestically, while the second best film, Central Intelligence, barely earned a quarter of that. I don’t think any film will come close to Finding Dory, but there’s a lot more depth this time around and I have high hopes 2017 will extend its lead.
More...
May 23rd, 2017
Comedy starring Will Ferrell and Amy Poehler opens June 30 ... Full Movie Details.
More...
.jpg)