March 3rd, 2018
-3-News.jpg)
The Independent Spirit Awards were handed out tonight, and Get Out was the big winner, sort of. It earned two Awards, including the two most prestigious, awards. However, it wasn’t the only film to pick up two awards tonight.
More...
November 22nd, 2017
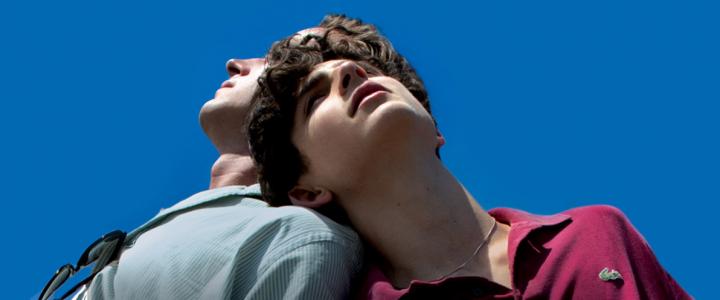
The Independent Spirit Awards nominations were announced yesterday and thus the 2017 Awards Season begins. The movie with the most nominations is Call Me by Your Name, which opens on Friday. This is amazingly good timing. It’s not the only film that should get a financial boost.
More...
November 8th, 2017
-1-News.jpg)
It is not a particularly strong week on the home market. Cars 3 is the biggest new release, but it is far from the best. There were not a lot of contenders for Pick of the Week. The Philadelphia Story and Your Name were the two best with the latter coming out on top and its Blu-ray Combo Pack is the Pick of the Week.
More...
October 25th, 2017
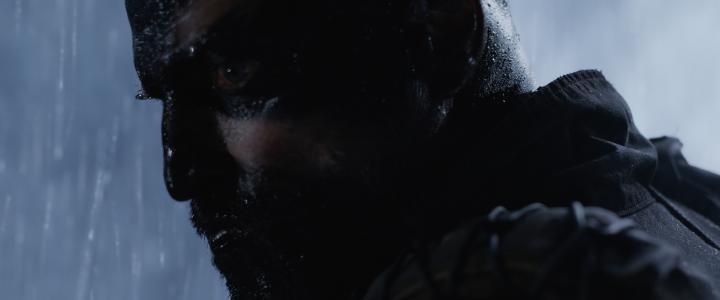
There are not many films on this week’s list of home market releases, but there are several bigger titles making their home market debut. Some, like Cars 3, are only coming out on Video on Demand, but there are also some serious Pick of the Week contenders hitting DVD / Blu-ray as well. Of these contenders, War for the Planet of the Apes has the best combination of reviews and extras on the Blu-ray Combo Pack.
More...
October 4th, 2017

Victoria and Abdul did something very few films manage to do, it repeated on top of the theater average chart. This past weekend, the film earned just over $1 million in 77 theaters for an average of $14,184. The only other film in the $10,000 club was Pearl Jam: Let’s Play Two, which earned an average of $10,635 in five theaters.
More...
September 6th, 2017
-1-News.jpg)
Labor Day long weekend wasn’t nearly as bad we were expecting, but it still wasn’t what you could call good. There were two films to earn more than $10,000 on the theater average chart, which is better than we’ve seen some weeks this year; however, those were the only two new releases to come close to $10,000. Dolores opened in one theater earning $13,534 and this is amazing for a documentary. Viceroy’s House earned an average of $12,034 in four theaters.
More...
August 30th, 2017
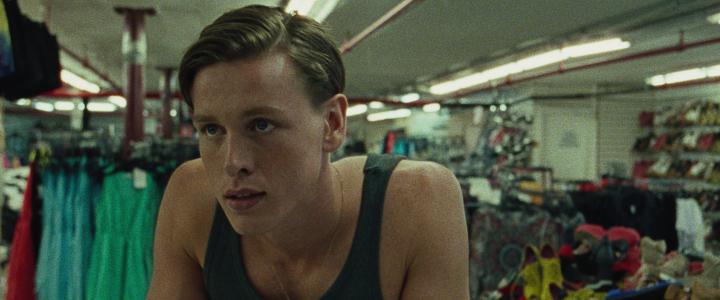
There was only one film to earn more than $10,000 on the theater average chart. Beach Rats earned an average of $15,484 in three theaters, putting it heads and shoulders above the rest of the new releases.
More...
August 27th, 2017

Things are so bad at the box office this weekend that it’s hard to figure out just how bad. We’ve been tracking box office since 1997, and have researched weekend reports back to the beginning of the 1980s, and a diligent search of our database doesn’t offer a weekend that’s clearly been worse than this one. Based on current ticket sales, it’s the 9th-worst in terms of consumer spending since 2000, with $66.6 million reported so far. That number will go up a bit when numbers are announced for all movies on Monday, but most likely only fractionally (I think we have numbers for everything that made over $500,000). But that figure doesn’t account for ticket price inflation. If we do so, things look even more dire…
More...
August 23rd, 2017

It was a shallow week on the theater average chart with only three films with averages above $10,000 and none that topped that mark by a serious margin. Gook topped the chart with an average of $13,522 in two theaters. Ingrid Goes West is arguably more impressive, as it earned an average of $10,284 in 26 theaters during its second weekend of release. The only other film in the $10,000 club was Crown Heights with an average of $10,058 in three theaters.
More...
August 20th, 2017
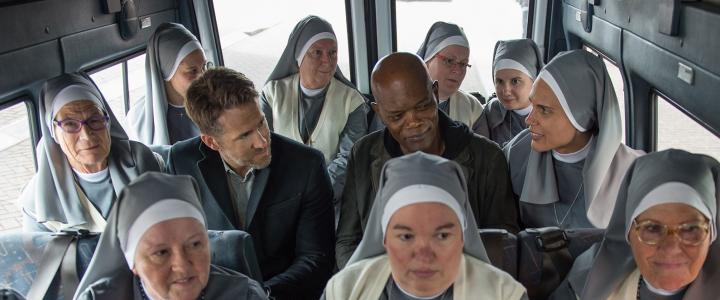
We’re at that point in the year when we’ll take what we can get at the box office, and The Hitman’s Bodyguard will deliver according to that lowered metric this weekend with about $21.6 million, according to Lionsgate’s Sunday morning projection. That’s in line with to a little ahead of expectations, but a B+ CinemaScore and mediocre reviews suggest it won’t have substantial legs. For Ryan Reynolds, the opening is ahead of this year’s Life, which debuted with $12.5 million, and well clear of 2015’s Self/Less ($5.4 million). Samuel L. Jackson, meanwhile, appears in such a mess of movies it’s hard to say how this compares to any one of them.
More...
August 16th, 2017
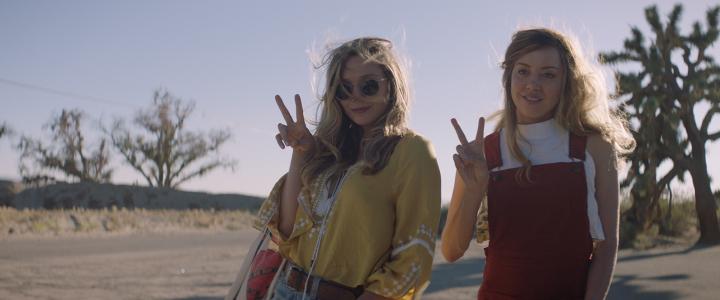
Ingrid Goes West opened in first place on the theater average chart with an average of $45,100 in three theaters. This is the third best average of the year behind The Big Sick (average of $84,315 in five) and The Beguiled ($57,323 in four). A24 had another success with Good Time earning an average of $31,275 in four theaters. The Trip to Spain opened with an average of $15,102 in three theaters, which is in the middle of the franchise average so far. Finally there’s Wind River, which was the only holdover in the $10,000 club. It managed an average of $13,615 in 45 theaters and already has nearly $1 million in limited release.
More...
August 13th, 2017
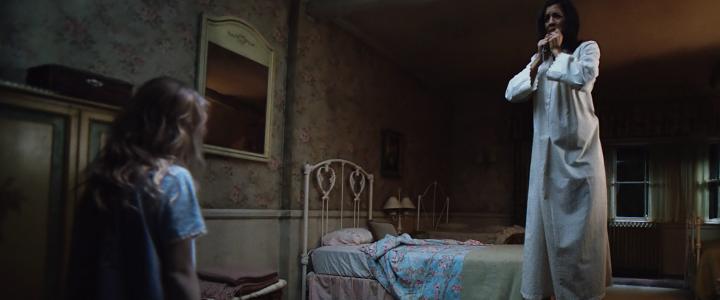
After a series of lackluster weekends at the box office, Annabelle: Creation is doing its bit to clear away the end-of-Summertime blues with a $35 million opening this weekend. That’s right in line with the $37 million Annabelle opened with three years ago, which is an impressive performance for a horror franchise. It’s also the best opening for a horror movie since Split’s $40 million start back in January. The first film in the franchise fell away quite rapidly, and ended up with $84 million in total, so a final total of over $100 million is far from assured, but with a production budget of only $15 million, and probably not much more than $20 million in marketing, this should be a highly profitable movie for Warner Bros., especially since the franchise is popular globally.
More...
August 11th, 2017
-1-News.jpg)
There are a number of limited releases coming out this week that are earning good reviews and / or strong buzz. Of these, The Trip to Spain is the one I want to see the most. It also has a good chance to earn more than $2 million in theaters, as its two predecessors did the same.
More...