April 20th, 2015
Interstellar was the top new release and the top selling DVD. However, its opening week numbers were decidedly not stellar. The film sold 291,000 units and generated $4.45 million in revenue. This is barely more than The Hobbit: The Battle of the Five Armies managed during its second week of release.
More...
April 20th, 2015
It was Easter the week the March 31st new releases came out and this had an effect with several, mostly family friendly films earning a boost on the Blu-ray sales chart. Even so, Interstellar opened in first place dominating the rest of the market. The film sold 732,000 units and generated $14.46 million in revenue, for an opening week Blu-ray share of 72%. Granted, this is a film that relies heavily on its special effects to draw in the audience, but that is still a shockingly high percentage.
More...
April 13th, 2015
The DVD sales chart was top heavy with new releases. The Hobbit: The Battle of the Five Armies earned first place with 682,000 units / $10.21 million, which is about on par with expectations. The Trilogy box set landed in 11th place with 33,000 units / $1.19 million.
More...
April 13th, 2015
There were five or six new releases to reach the top twenty on the Blu-ray sales chart. Leading the way was The Hobbit: The Battle of the Five Armies with 832,000 units / $23.28 million, giving it an opening week Blu-ray share of 55%. This is a strong result, but not an unexpected one, as the film hits the right marks for strong sales on Blu-ray. It is a visually impressive film, it is a fantasy adventure film, and it is based on a popular franchise. The Battle of the Five Armies was also part of a franchise box set, which is the tenth best selling release of the week with 37,000 units / $1.87 million for a 53% opening week Blu-ray share. Technically these are two separate releases, but obviously they are connected enough to mention together.
More...
April 7th, 2015
Just as it was on the Blu-ray Sales Chart, there was a tight race for top spot in the DVD sales chart, only the combatants weren't entirely the same. Exodus: Gods and Kings topped Annie in terms of units at 226,000 units to 202,000 units, but the pair finished in the opposite order in terms of revenue with $3.59 million to $3.38 million.
More...
April 7th, 2015
New releases earned the top three spots on the Blu-ray Sales Chart this week, including a tight race for top spot. Penguins of Madagascar earned first place over Exodus: Gods and Kings in terms of units, 269,000 vs 257,000. However, in terms of revenue, the pair finished in the reverse order at $5.91 million to $5.38 million. As far the their opening week Blu-ray shares are concerned, Penguins managed a very strong 58%, while Exodus managed a very healthy 54%
More...
March 17th, 2015
It's a busy / short week on the home market. There are four first-run releases coming out this week, which is more than most weeks. However, it is also a very shallow week and we run into filler on the first page of Amazon's list of best-selling new releases. The best of the first-run releases is Top Five, but the DVD or Blu-ray Combo Pack isn't quite Pick of the Week material. For that honor, we have to look to a smaller release, Song of the Sea on DVD or Blu-ray Combo Pack.
More...
February 19th, 2015
Fifty Shades of Grey dominated the international box office with an opening weekend of $158 million in 58 markets over the weekend for a total opening of $173.56 million. Worldwide, the film took $258.73 million during its opening weekend, which puts it just behind Taken 3 for the year. It became the biggest hit shortly after the weekend ended. The film's biggest market was in the U.K., where it made $20.90 million in 586 theaters. This is better than it opened with here, relative to the size of the two markets, so we can blame the U.K. for the success of this film. It also did incredibly well in Germany ($15.2 million on 741 screens); France ($12 million on 785); and Russia ($10.68 million on 1,105). Obviously the film is going to be turned into a franchise.
More...
January 29th, 2015
The Hobbit: The Battle of the Five Armies easily earned first place in China and that helped it rocket back to the top of the international chart with $54.3 million over the weekend for totals of $617.0 million internationally and $866.5 million worldwide. The film had a total opening of $50.00 million in China, which was more than the rest of the market combined.
More...
January 22nd, 2015
Taken 3 rose to first place during its third weekend of release earning $31.4 million in 49 markets for an international total of $99.0 million. Its biggest debut of the weekend was in the Philippines, where it earned first place with $2.5 million on 218 screens. It also earned first place in Russia, but with only $1.80 million on 1,438. Its biggest market was the U.K., where it remained in first place with $5.00 million in 500 theaters for a two-week total on $18.55 million.
More...
January 15th, 2015
Night at the Museum: Secret of the Tomb rose to first place with $46.2 million in 48 markets for totals of $148.6 million internationally and $248.1 million worldwide. This includes a $26.39 million "opening" in China for an 8-day total of $31.06 million. 8-day opening? It also opened in first place in Russia with $5.55 million on 1,690 screens.
More...
January 7th, 2015
It was a big week for The Hobbit: The Battle of the Five Armies, as it crossed the $500 million mark on the international box office. Over the weekend it pulled in $52.5 million in 65 markets for totals of $504.7 million internationally and $725.3 million worldwide. At this pace, the film will reach $800 million worldwide, possibly as early as this time next week. As for last weekend, there were very few new openings, but the film did earn first place in Argentina with $2.1 million on 397 screens. The film opens in China before the end of the month and the studio is obviously hoping for big numbers in that market.
More...
January 1st, 2015
For the third week in a row, The Hobbit: The Battle of the Five Armies held onto first place with $89.0 million in 62 markets for totals of $405.1 million internationally and $573.6 million worldwide. The film opened in first place in Australia with $10.1 million on 603 screens, while the film was particularly strong in Poland earning $5.3 million on 699. By this time next week, it should be at $500 million internationally and $700 million worldwide, which is enough to break even, but not enough to keep pace with the franchise average.
More...
December 23rd, 2014
The Hobbit: The Battle of the Five Armies remained in first place with $109 million in 59 markets for a two-week total of $269 million internationally and $358 million worldwide. It is still too early to tell where this film will end up, but by this time next week it should be well past $500 million worldwide, which is enough to pay for its production budget. The film debuted in first place in South Korea with $10.3 million. Meanwhile, it was tops in Spain and Italy with $6.5 million and $6.1 million respectively. Despite opening in nearly two dozen new markets, the film's biggest market was a holdover, Germany, where it added $13.3 million over the weekend to its running tally, which now sits at $38.6 million. It was also strong in the U.K. earning $8.5 million over the weekend for a total of $31.8 million after two, while in France the film made $8.2 million over the weekend for $25.5 million, also after two weeks of release.
More...
December 17th, 2014
The Hobbit: The Battle of the Five Armies started its international run earning first place with $122.2 million on 15,395 screens in 37 markets. Not only did it earn the best opening of The Hobbit Trilogy, but it was often times the biggest opening in Peter Jackson's career, or even occasionally in Warner Bros' history. Its biggest opening came in Germany where it pulled in $20.5 million on 1,442 screens. Next up was the U.K. and France, which had nearly identical openings of $15.2 million on 1,489 screens and $15.1 million on 914 screens respectively. It earned $13.56 million on 2,390 screens in Russia. Brazil and Mexico were neck-and-neck with $6.8 million on 1,037 screens and $6.3 million on 2,775 screens respectively. It earned $2.4 million on 640 screens in Japan, which seems low compared to the other markets, but it is nearly double the debut The Desolation of Smaug earned.
More...
December 15th, 2014
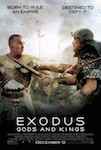
All-in-all, the box office matched expectations, but sadly, that is not a good thing. Exodus: Gods and Kings opened with $24.12 million, which is anemic for a film that cost $140 million to make. Top Five had a better per theater average, but was playing in less than 1,000 theaters, so it will only become a midlevel hit, at best. Overall, the box office did rise 6.8% from last weekend, but this still only amounted to $83 million. Worse still, this was 43% lower than the same weekend last year. Last year, The Hobbit: The Desolation of Smaug opened with $73.65 million, which is about 2% less than the top ten earned this year. It should come as no surprise that 2014 lost in the year-over-year comparison, while it continues to lose ground in the year-to-date race as well. Currently, 2014 has pulled in a total of $9.41 billion, which is 4.8% or $470 million lower than last year's pace. There's no chance 2014 will catch up at this point. I just hope it doesn't sink any lower.
More...
December 14th, 2014
Big budget bible epic Exodus: Gods and Kings is probably the riskiest studio bet this Holiday Season. The $140 million-budgeted film will need to do considerable business domestically and internationally to earn a profit, and biblical epics haven’t had the best of track records in recent years. Early signs aren’t great, with Fox projecting a $24.5 million opening weekend, well behind the $43.7 million earned by Noah earlier in the year. There is room for the film to recover though, as it will almost certainly be able to keep playing in a lot of theaters through the New Year. $100 million seems like the top end of domestic expectations at this point, and its international performance so far doesn’t suggest overseas coin will help make up the difference.
More...
December 11th, 2014
The box office has been struggling the past few weeks and / or months. It really depends on how you look at things. This weekend there are two films hoping to help 2014 get back into the win column: Exodus: Gods and Kings and Top Five. Exodus will win the weekend with relative ease, but it might not earn more than $20 million in the process. Top Five would like to earn second place with just over $10 million, but it will probably fall short finishing just behind The Hunger Games: Mockingjay, Part 1. This weekend last year, The Hobbit: The Desolation of Smaug led the way with $73.65 million. That's more than the top five will make in total this year. It might be more than the top ten earn. Even last year's second place film, Frozen, might make more than the top film this year will earn. 2014 is going to lose in the year-over-year comparison by a large margin.
More...
December 11th, 2014
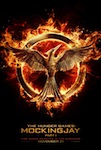
The Hunger Games: Mockingjay, Part 1 reached a couple of milestones hitting $500 million worldwide before the weekend and $300 million internationally during the weekend. Over the weekend, the film pulled in $32.9 million in 87 markets for three-week totals of $306.6 million internationally and $564.8 million worldwide. The film will top $600 million worldwide over the weekend, while it is on pace to top the original's worldwide total before the end of its run.
More...
December 9th, 2014
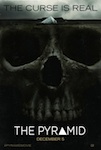
The post-holiday weekend is rarely a great weekend and this weekend was no exception. The Hunger Games: Mockingjay, Part 1 fell more than 60%, while no film in the top ten fell less than 40%. The only wide release in the top ten was The Pyramid, which barely topped the Mendoza Line. Overall, the box office fell 52% from last weekend to $78 million. That's 16% lower than the same weekend last year. Year-to-date, 2014 is behind 2013 by a 4.5% or $440 million margin. It is not going to close that margin over the next four weeks, but it should still top $10 billion before the year is over.
More...
December 5th, 2014
It's the weekend after Thanksgiving, one of the worst weekends of the year for a new release. This year, no film is daring to open wide, but The Pyramid is coming the closest opening in just under 600 theaters. The film would need a per theater average of more than $10,000 to reach the top five, which is nearly impossible at this stage. This means the top five this week will mostly be the same as the top five last week with The Hunger Games: Mockingjay, Part 1 leading the way. Likewise, this weekend last year, Frozen led the way with more than $30 million. There is very little chance Mockingjay, Part 1 will match that, so 2014 will lose yet again in the year-over-year comparison.
More...
December 4th, 2014
The Hunger Games: Mockingjay, Part 1 remained in first place with $67.0 million in 86 markets for a two-week total of $254.6 million. Its worldwide total rose to $480.3 million. I would be surprised if the film hasn't already broken even, even though it will have the lowest box office in the franchise. The film remained in first place in Australia with $7.52 million on 574 screens over the weekend for a total of $22.69 million after two weeks of release. It was pushed into second place in the U.K., but still pulled in $7.69 million in 569 theaters for a two-week total of $33.32 million.
More...
December 3rd, 2014
The winner of our Black and White contest was determined and it is...
More...
December 2nd, 2014
Thanksgiving weekend was... well, it wasn't good. The Hunger Games: Mockingjay, Part 1 easily won the race for top spot and actually topped expectations by a tiny margin. On the other hand, the two new releases, Penguins of Madagascar and Horrible Bosses 2, both really struggled. Neither managed to top their three-day prediction over the five-day long weekend. Overall, the three-day weekend fell 17% to $162 million from last weekend. Worse still, this was 22% lower than the same weekend last year. 2014 is now behind 2013 by a margin of $370 million or 3.9% at $9.20 billion to $9.58 billion. There's no way we will catch up by the end of the year. I just hope we don't fall further behind.
More...
November 27th, 2014
It's Thanksgiving weekend and there are two films trying to take advantage of the boost to the box office. Penguins of Madagascar looks like it will top Horrible Bosses 2 at the box office, but neither really have a shot at dethroning The Hunger Games: Mockingjay, Part 1 for top spot. In fact, it is possible both of them combined won't top last year's number one new release, Frozen. Additionally, Mockingjay, Part 1 very likely won't match Catching Fire by a significant margin, so November will end the month on a down note.
More...
November 27th, 2014
The Hunger Games: Mockingjay, Part 1 opened in first place on the international chart with $154.3 million in 85 markets for a worldwide opening of $276.2 million. Its international opening was about 4% higher than the previously entry in the franchise. The film managed $19.8 million in the U.K. and $13.8 million in Germany. This was 5% and 9% higher than the previous film's debut in those two markets. Mockingjay, Part 1 opened 19% higher in Russia with $11.9 million. The film also topped $10 million in Mexico ($12 million) and Australia ($10.3 million).
More...
November 20th, 2014
Next weekend is Thanksgiving weekend and there are two films hoping to not be crushed by The Hunger Games: Mockyingjay, Part 1, which will be in its second week of release. Penguins of Madagascar will likely beat out Horrible Bosses 2 for second place and as such, it is the choice for the target film for this week's box office prediction contest. In order to win, one must simply predict the opening weekend box office number for Penguins of Madagascar.
Whoever comes the closest to predicting the film's opening 3-day weekend box office (Friday to Sunday), without going over, will win a copy of Jeff Dunham: All Over the Map on Blu-ray.
Whoever comes the closest to predicting the film's opening 3-day weekend box office (Friday to Sunday), without going under, will win a previously reviewed DVD or Blu-ray.
Entries must be received by 10 a.m., Pacific Time on Friday to be eligible, so don't delay!
More...
November 20th, 2014
Interstellar remained in first place with $107.9 million in 63 markets over the weekend for totals of $225.8 million internationally and $322.7 million worldwide. This might be enough to cover the film's production budget, but probably not. That said, by this time next week, its worldwide total will be close to $500 million, which should put the film in the black. This weekend the film opened in first place in China with $42.67 million during its five-day opening. Perhaps more impressively, the film grew by 6% in South Korea helping it remain in first place with $13.13 million on 1,410 screens over the weekend for a total of $35.24 million after two weeks of release. It didn't hold up quite as well in the U.K., but still remained in first place with $5.91 million on 576 screens over the weekend for a total of $19.11 million.
More...
October 31st, 2014
October was a better than expected month with the overall box office keeping pace with October of 2013, for the most part. (The last weekend will be terrible, but that's because of Halloween.) We were able to close the gap somewhat in the year-over-year comparison, at least by a little bit. So how will November do compared to October. Let's put it this way. There are only seven films opening wide this month. Of those, Beyond the Lights will likely not make an impact at the box office. Every other film has at least a reasonable shot at $100 million. More than half the of the films opening this month could hit $200 million. Leading the way will be The Hunger Games: Mockingjay, Part 1, which could hit $400 million. The only problem is when book franchises split the final installment into two parts, the first part tends to be weaker at the box office. Interstellar is a big question mark. On the low end, it could make just over $100 million, while on the high end, just over $300 million is within reach. That's a wide range of expectations. On the downside, last November, there were two movies to reach $400 million: Catching Fire and Frozen. On the other hand, there was only one other movie to make more than $100 million, Thor: The Dark World, so perhaps the depth this year will help 2014 come out ahead in the year-over-year comparison.
More...