April 1st, 2010
Not only did eight new releases reach the top 30 on this March 14's sales chart, but they were very top-heavy on the chart, taking the top three spots and six of the top seven. The new number one DVD was Precious with 726,000 units sold and $12.34 million in consumer spending at retail during its first week of release.
More...
March 9th, 2010
We have a pair of Awards Season players coming out this week. I was supposed to review both Precious and Up in the Air, but they ran out of screeners for the latter. Because of that, it is hard for me to say which one is more deserving of the Pick of the Week honors, so I'm going to award that title to both of them. That said, while the DVD and the Blu-ray for Precious are worth picking up, the Up in the Air Blu-ray is too expensive compared to the DVD.
More...
February 28th, 2010
Shutter Island started its international run with a sixth place finish this past weekend, earning $9.28 million on 1229 screens in 9 markets. The film opened in first place in Spain with $3.25 million on 406 screens. It had to settle for second place in Australia, in a virtual tie with Valentine's Day at $2.50 million on 250 screens. It's way too early to tell where the film will end up, but matching its domestic run internationally is a solid goal.
More...
February 21st, 2010
As expected, The Princess and the Frog reached $100 million internationally just before the weekend started, ultimately overtaking its domestic total. It had no major market openings over the past weekend, but it managed to rise to first place in France with $4.09 million on 697 screens for a total of $17.31 million after three. It also remained solid in the U.K., adding $2.36 million on 501 screens for a total of $6.58 million. Overall, it pulled in $11.29 million on 3349 screens in 34 markets for a total of $111.94 million internationally and $213.69 million worldwide.
More...
February 14th, 2010
For the first time during its international run, Alvin and the Chipmunks 2: The Squeakquel missed the top five and placed sixth with $7.10 million on 3,699 screens in 42 markets for a total of $200.87 million internationally and $413.03 million worldwide.
With no major market openings left, the film will likely fall further down the chart over the coming weeks, but it has already made a huge profit, so Fox will be more than happy.
More...
December 20th, 2009
Arthur And The Revenge Of Maltazard fell out of the top five, but still did relatively well, earning $8.14 million on 2,198 screens in 19 markets for an early total of $23.58 million. In its native France it added $6.27 million on 925 screens over the weekend for a total of $17.57 million after two. This is not that much weaker than the original, which at this point had made just over $20 million in France.
More...
December 13th, 2009
A number of international releases reached the top 30 this week, including Zweiohrkuken, a.k.a. The Chicken With Two Ears, from Germany, which placed sixth with $10.72 million on 839 screens in 3 markets.
It made $9.39 million on 714 screens in its native market, which was easily enough for first place and more than twice what the original,Keinohrhasen, a.k.a., No Ear Hare, opened with in 2007.
Keinohrhasen went on to earn $74 million worldwide, of which more than $60 million was earned in Germany.
However, I don't think this film will have the same legs.
That said, since it was written, directed, and stars Til Schweiger who was recently in Inglourious Basterds, it could earn see releases in more markets.
More...
December 2nd, 2009
The Twilight Saga - New Moon remained in the top spot on the international chart with $82.38 million on 8,292 screens in 52 markets for a total of $251.33 million internationally and $482.28 million worldwide.
This includes a number of new markets for the film, but most were of the smaller variety.
It did place first in Germany with $16.95 million on 703 screens, but that includes previews.
On the other hand, it bombed in Japan, opening in fifth place with just $792,000 on 197 screens and was even worse in South Korea, debuting in eighth place with $129,000 on 47 screens over the weekend and $166,000 in total.
As far as holdovers go, the film was surprisingly consistent at roughly 60% down in most major markets.
This includes the U.K. where it was down 63% to $7.11 million on 504 screens; however, it still managed first place in that market, while it now has $33.57 million after just two weeks of release compared to the lifetime total of $16.31 million for its predecessor.
It is important to note that Twilight was surprisingly weak in the U.K. compared to its box office performance in most major markets.
That said, New Moon has topped the lifetime total of the earlier film in every single major market it opened in last weekend, which is an amazing feat.
It has yet to open in only a few other markets, but unless the film cost a lot more to make than has been reported, it has already shown a sizeable profit.
More...
November 30th, 2009
Thanksgiving was a record-breaking weekend in more than one way.
First, total ticket sales amounted to $188 million over three days and $273 million over five, which is a record for the long weekend.
Over the three-day portion of the weekend, the box office was actually down 28% from last weekend, but compared to last year it was up just under 16%, while the five-day total was nearly 17% higher.
Year-to-date, 2009 has earned a total of $9.52 billion, which is 8.4% higher than the same point last year.
In fact, 2009 is now the third-highest-grossing year of all-time and just $150 million away from earning the crown.
Breaking the record for total box office is just a matter of when, not if, while 2009 could be the first year total ticket sales crack $10 billion.
More...
November 29th, 2009
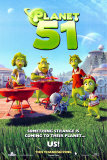
Planet 51 started its international run in a limited fashion, but was only a little better than its domestic opening. Its biggest market was Russia, where it placed fourth with $1.49 million on 344 screens, which is on par with its opening here, perhaps a little bit stronger.
The film also placed fourth in Italy with $1.16 million on 255 screens, which is again on par with the US, but perhaps a little weaker.
Overall, it landed in sixth place with $3.22 million on 894 screens in 6 markets during its opening weekend, but should improve this weekend when it opens in Spain, Mexico, and Brazil.
More...
November 23rd, 2009
New Moon broke all manner of records over the weekend, which was great news for Summit, and for the industry as a whole.
New Moon made more all by itself than all other movies combined pulled in last weekend and the overall box office was $259 million, the second biggest weekend on record.
Compared to last week, we saw a 85% increase, while compared to the same weekend last year, 2009 grew by 57%.
Year-to-date, 2009 has now pulled in $9.20 billion, which is just shy of 8.0% higher than last year's pace.
Additionally, it is just ahead of 2002's final tally, making 2009 the sixth biggest year so far, and we have more than a full month ahead, including two major holidays.
Simply amazing.
More...
November 22nd, 2009
After enjoying impressive box office and home market sales over the last year for Twilight, the industry knew that Summit had a potential blockbuster franchise on its hands.
This weekend has proved that they have a franchise as big as anything else in the industry.
The Twilight Saga: New Moon opened on Friday with an extraordinary estimated $72.7 million, the biggest single day in box office history (see list).
And, while it couldn't quite maintain that pace through the entire weekend, the studio reported a final weekend estimate of $140.7 million this morning, the third-biggest weekend of all time (see list).
More...
November 19th, 2009
This could be a surprising weekend at the box office, as the buzz for New Moon has hit new heights of insanity.
There's no doubt that it will be the number one film of the weekend, and almost no doubt that it will top Twilight, which was the number one film this week last year.
It appears the only real question is how many records can it break along the way.
More...
November 1st, 2009
October was not a month to remember, as only two films really beat expectations. (Although Paranormal Activity was the most unexpected hit during the October, it actually opened in September, so one could argue it's not really an 'October hit'.) This month we have a massive collection of potential blockbusters, some potential Oscar contenders, as well as a few unfortunate films that might be squeezed out by the competition. Compared to last November, we might have the same number of $100 million hits, assuming all movies match expectations (fat chance); we have a limited release from this month become the Awards Season darling and reach that milestone (monstrously unlikely); and we count The Princess and the Frog as a November releases (intellectually dishonest). That said, if three or four legitimate November releases reach that milestone, then 2009 will be on pace to tie or break the record for most $100 million released in one calendar year. But overall, 2009 will likely see its lead over 2008 shrink during the next 30 days.
More...
July 17th, 2008
This week's round of new casting information contains updates for Humboldt County, Nine, The Perfect Game, and more!
More...
July 13th, 2008
This week's round of new movie release information contains release dates for The Perfect Game, Mister Foe, Planet 51 and more!
More...
February 24th, 2008
This week's round of new casting information contains updates for Ghosts of Girlfriends Past, Hoodwinked 2, Shanghai, and more!
More...
February 19th, 2008
This week another number of upcoming movies, new stars and directors have been added to our archive!
More...
February 3rd, 2008
This week's round of new movie release information contains release dates for Igor, Up, Planet 51 and more!
More...